The MBW Review gives our take on some of the music biz’s biggest recent goings-on. This time, we take a look at Netflix‘s revelatory latest quarterly results – in which it posted $2.8bn in revenue and nearly $70m in profit – within the context of recent updates from Apple and Spotify. The MBW Review is supported by FUGA.
That wasn’t the original headline to this article.
The original headline to this article was actually: ‘Netflix is growing faster than Apple Music – despite being 20 years old.’
That’s true (although Netflix’s video-on-demand service didn’t technically launch until 2007 – so ‘despite being a decade old’ might have been a tad fairer.)
Yet in the process of writing up this story, and putting together some research for its arrival, we discovered something more important.
It’s a single graph which explains in a snapshot why Netflix is storming ahead as a profitable subscription company… and why Spotify is not.
But before all of that, a bit of background.
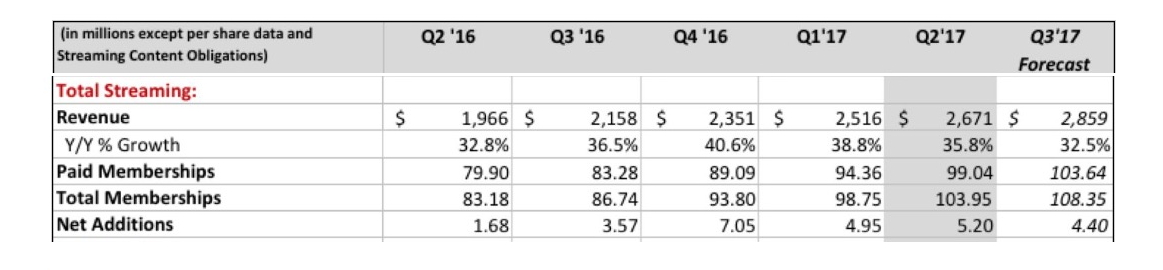
Yesterday, Netflix issued its latest quarterly financial results, for the three months to end of June (Q2 2017).
The big story for the subscription video company was that total users of its platform in the period topped 100m, at 103.95m people.
However, this figure included those taking advantage of its month-long free trial and other freebie accounts.
In terms of those coughing up hard cash, Netflix counted 99m paying subscribers at the end of Q2.
That was up 4.7m on the prior quarter (Q1 17) – an average of just under 1.6m net subscriber adds per month.
This growth helped Netflix post $2.8bn in quarterly revenue in Q2, up 32% year-on-year.
Net profit came in at $65.6m, up 60% on Q2 2016.
How did that subscription growth compare to Apple Music and Spotify’s recent performance?
Apple confirmed last month that Apple Music had surpassed 27m subscribers.
That meant the service added 7m subscribers in the first six months of 2017.
Spotify, meanwhile, last officially updated its subscriber count in March, when it confirmed that it had topped 50m subs – up 10m on the number it revealed six months previously.
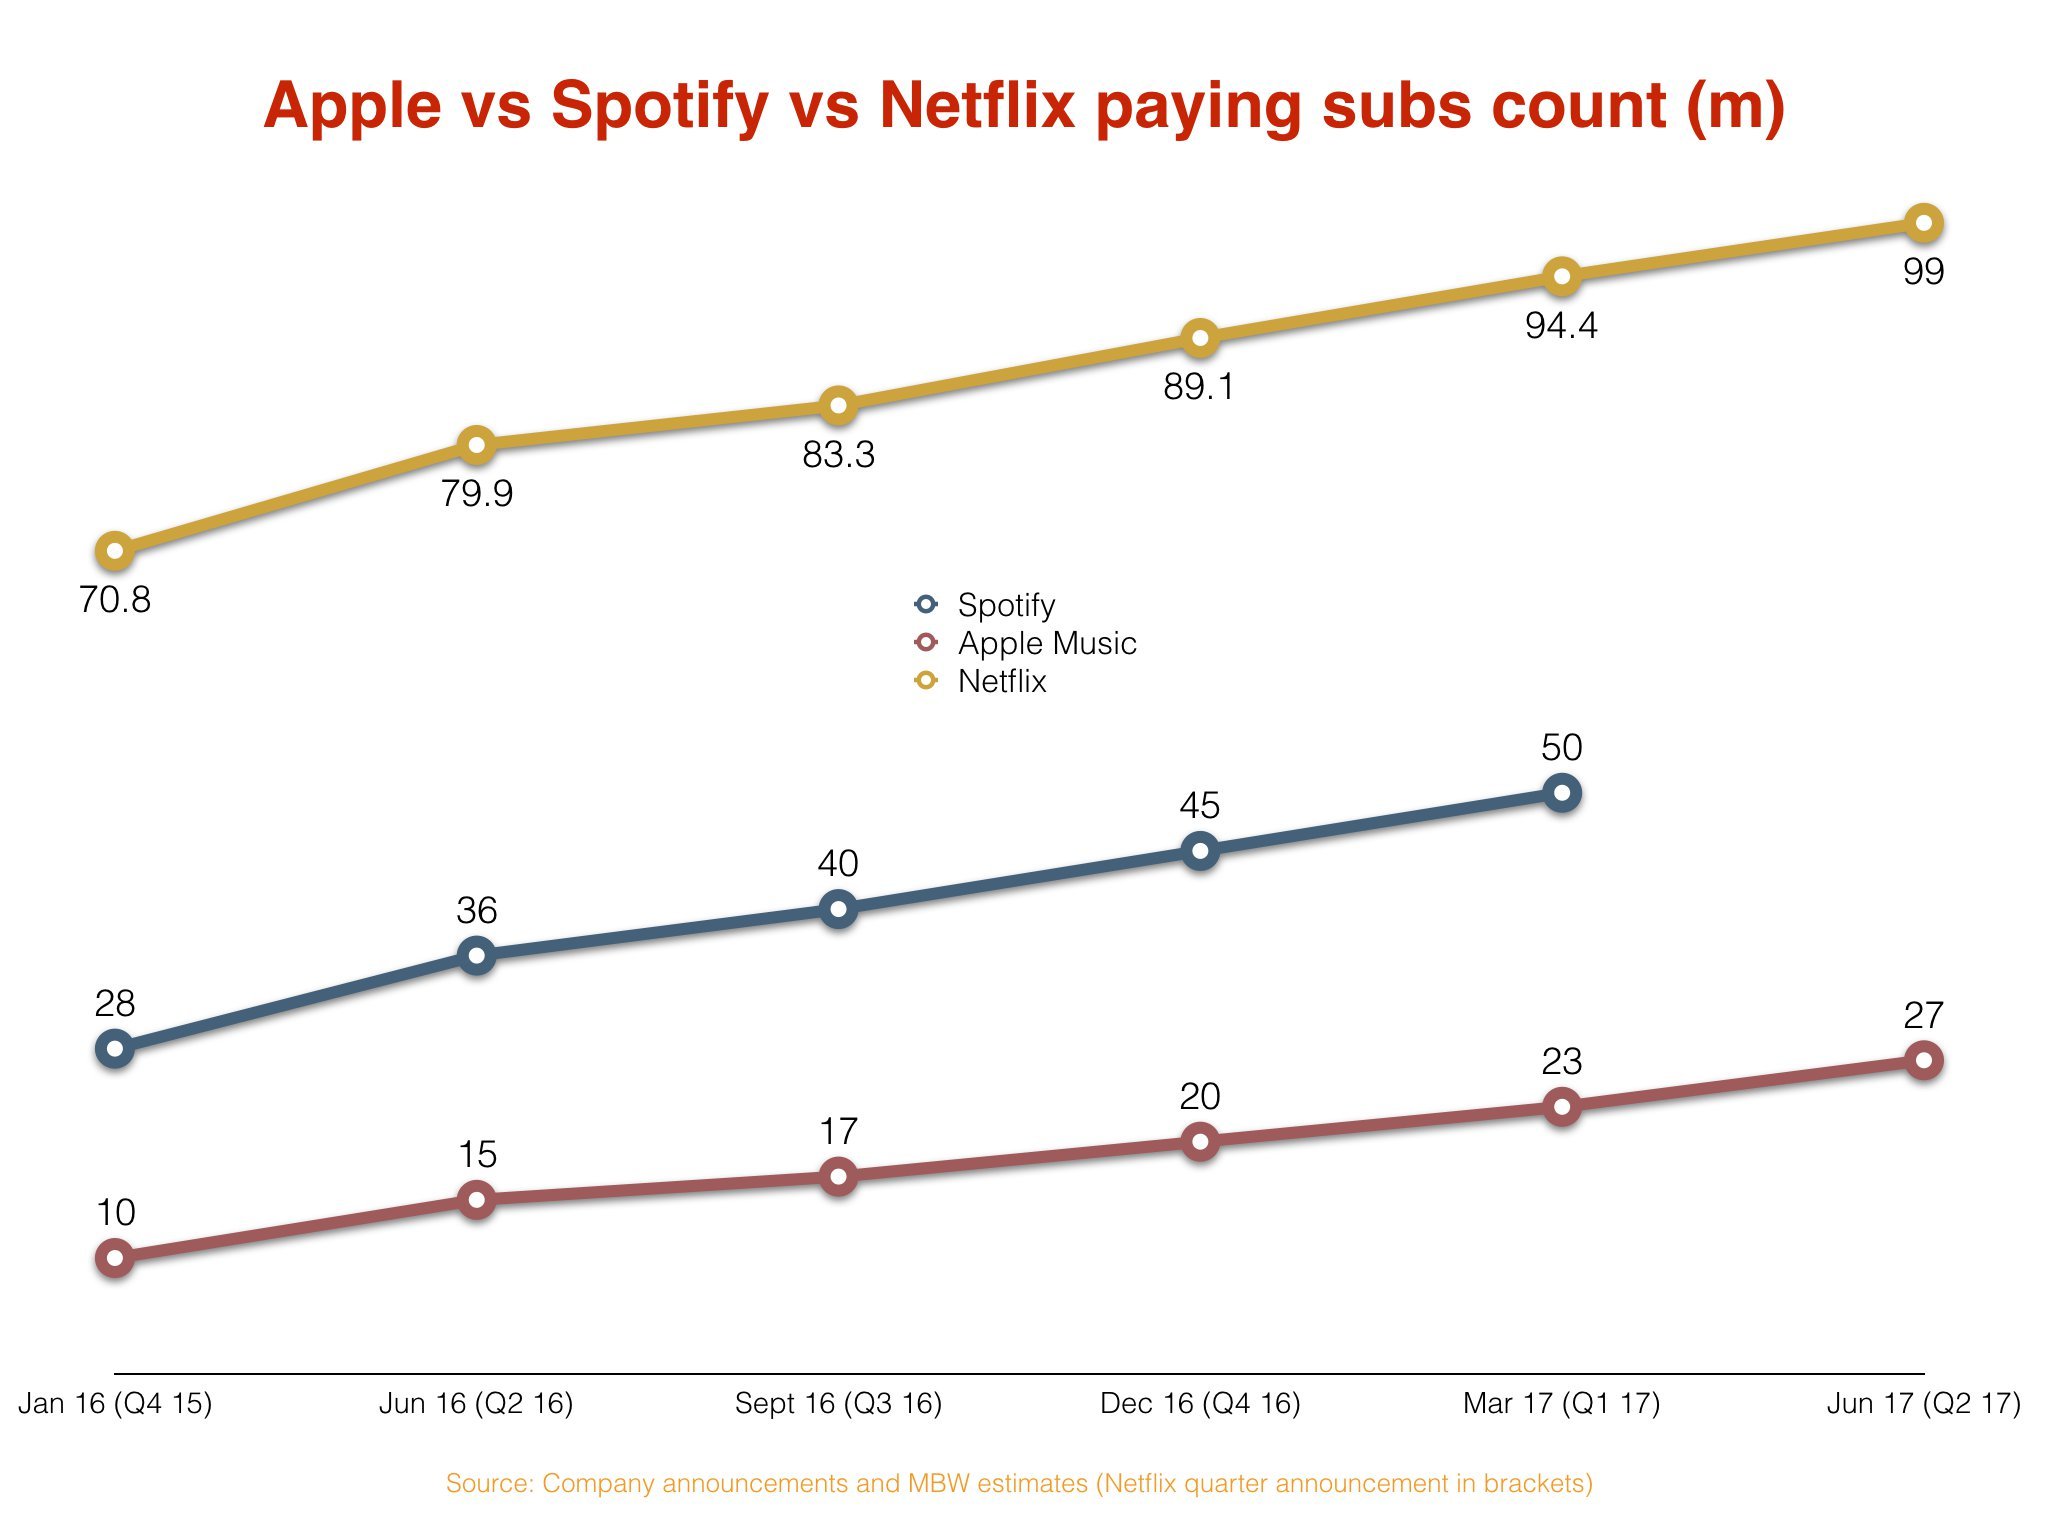
Now, take a look at the below: a comparison of Spotify and Apple Music growth numbers, run alongside Netflix’s official updates for each nearest quarter.
As you can see, in the six months to end of June, Netflix added no less than 9.9m paying subscribers (from 89.1m to 99m).
That showed significantly faster growth than the 7m climb at Apple Music. (Apple Music has a neatly comparable business model to Netflix in terms of no ‘freemium’ tier – although Apple’s free trial period is three months long.)
Netflix’s increase so far this year is also in line with the six-month subscriber growth (10m) last seen at Spotify.
These stats got us thinking…
MBW recently reported that Spotify’s average subscriber is now paying around $30 a year less than they were three years ago.
The dilution of this average spend is down to a number of factors.
Some of these are to do with promotions/marketing (mobile phone telco bundles, three-months-for-$1 loss leading deals etc.) and some of them are to do with international expansion (a premium Spotify sub in Indonesia, for example, will cost you Rp 49,990 per month – the equivalent of US $3.80).
If Spotify could have just pushed up its average annual subscriber spend by $8 across 2016 – or $0.67 a month – Daniel Ek‘s company would have posted an annual operating profit (as opposed to a $387m operating loss).
Makes you wonder how Netflix’s average subscriber spend might have changed over the same period.
The answer? It’s gone up, as Spotify’s has gone down.
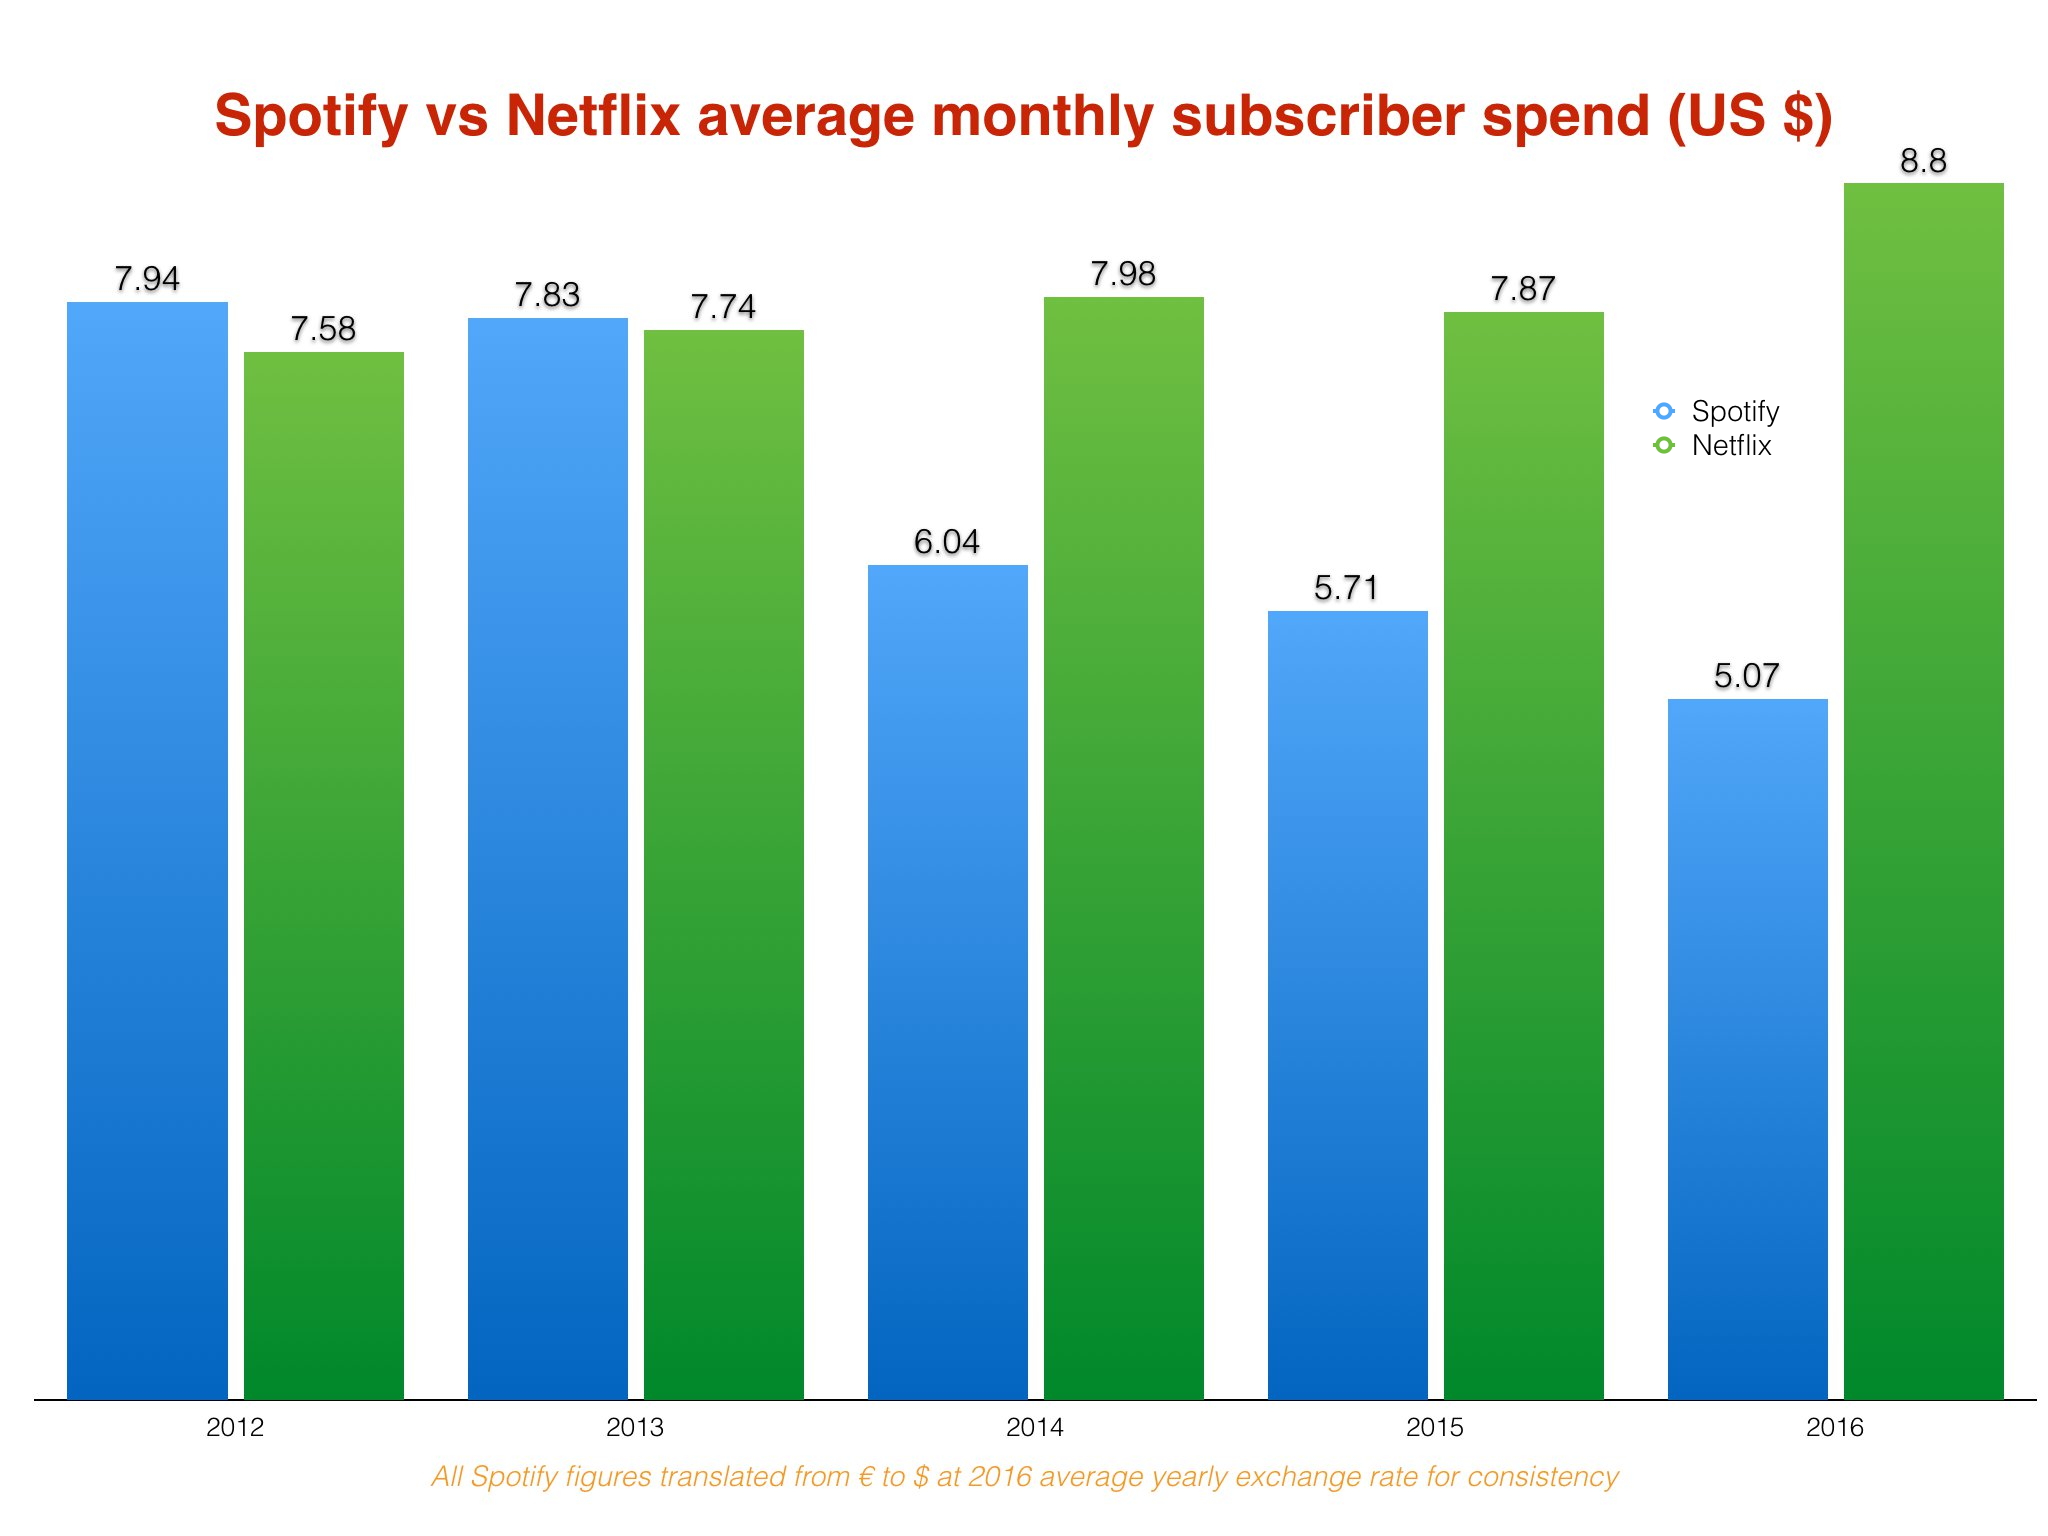
The above comparison needs a little further explanation.
Netflix’s average monthly subscriber spend has been calculated by taking the firm’s total subs revenue at the end of Q4 of each year, then dividing it by the firm’s total paying subscriber count in the same period – and then splitting by three to give a mean monthly average.
Spotify’s has been worked out slightly differently: dividing its total annual subscription revenue with its subscriber base at the end of December in each case.
On Spotify’s side, this gives us an inevitably low-end approximation of Average Revenue Per Subscriber (ARPS), but it’s still within the realms of accuracy.
So, science done… back to ‘Netflix up, Spotify down’.
Here’s the line graph that gave us our headline above. Just look at the difference between 2012 and 2016.
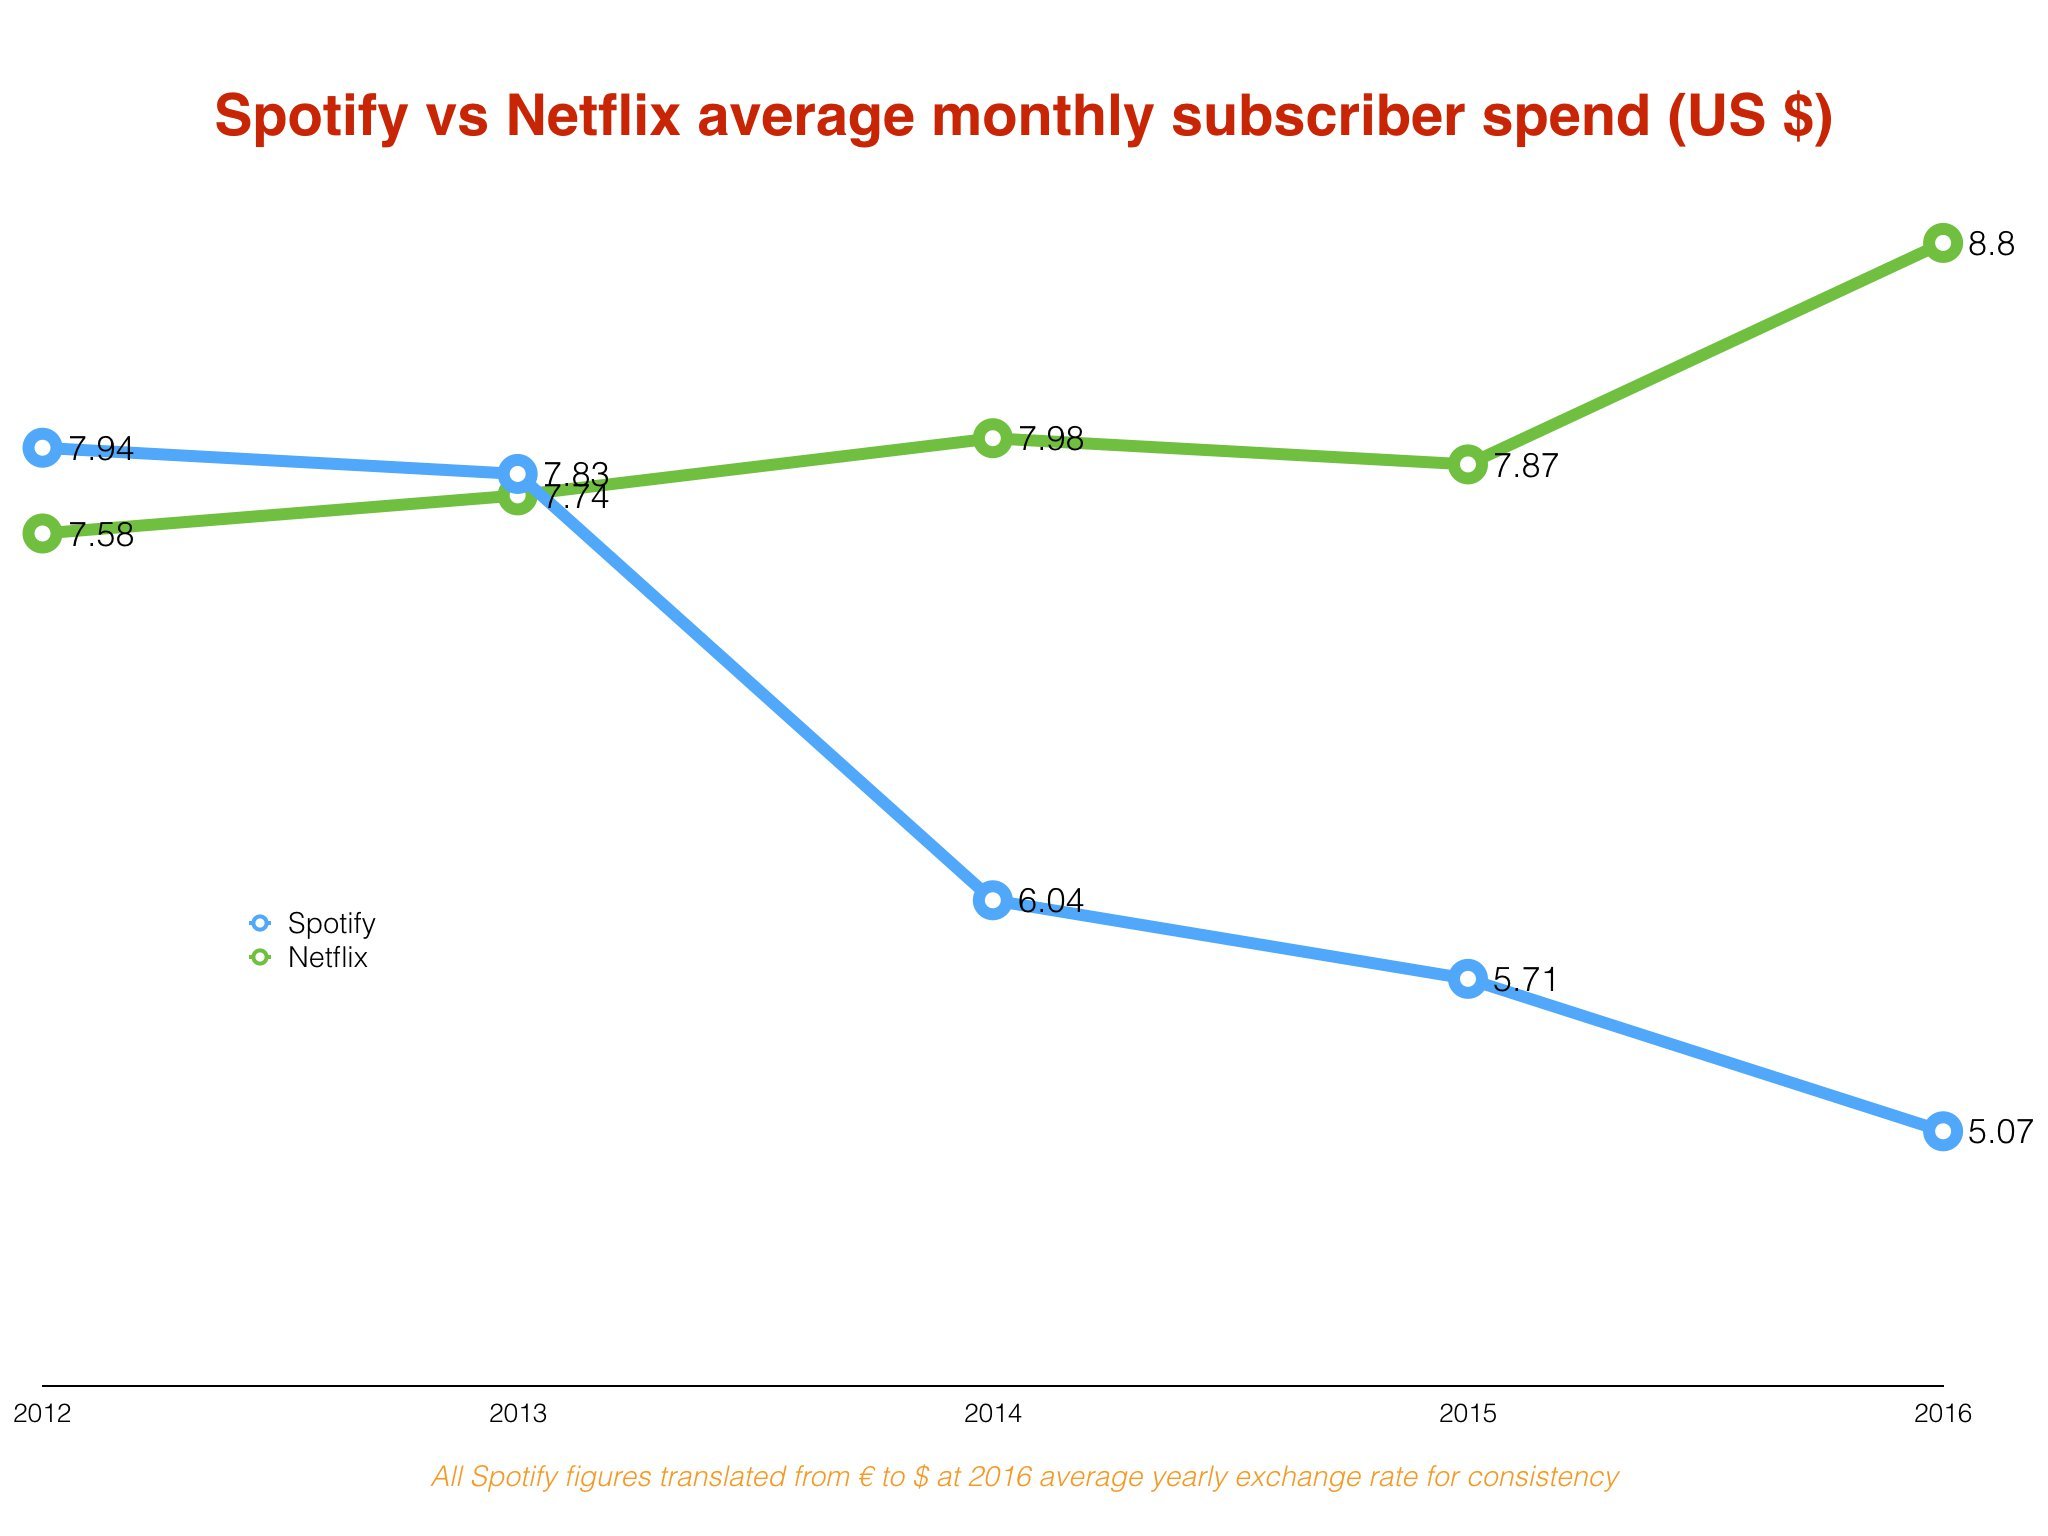
Interestingly, in 2015, Netflix announced it was raising its prices – moving up its standard HD subscription charge in the US from $9-a-month to $10-a-month.
Alongside this move, the company brought in an SD subscription tier at $8-a-month, while also launching an ultra-HD tier at $12-a-month.
These new prices, and the opportunity to upsell customers to an ultra-HD/4K package, explains the near-dollar rise in ARPS in the chart above. (In Q4 2016, Netflix’s streaming operation generated $2.35bn, up 41% YoY.)
Recent reports suggest more Netflix price hikes could be on the way later this year.
Remember: Netflix and Spotify are now growing at almost exactly the same rate of 10m net subscriber additions every six months.
But only one of these companies is pushing the average spend of these new customers further and further down.
Guess what? It’s the one that’s losing money.

Music Business Worldwide