The MBW Review offers our take on some of the music biz’s biggest recent goings-on. This time, we dig into the key numbers surrounding EMI Music Publishing to see how it would have affected Sony’s status as one of the biggest music companies on earth last year. The MBW Review is supported by Instrumental.
2017 was a gangbusters year for music publishing acquisitions – with over $700m transacted across the sale of SONGS (to a Kobalt-managed fund) and Imagem (to Concord Music) alone.
2018 has already taken one look at this hefty cumulative price, cracked its knuckles, and – as popular social media parlance would have it – confidently stated: ‘Hold my beer.’
Last week, we learned that Sony Corporation has agreed to pay $2.3bn for a further 60% stake in EMI Music Publishing – a fee which will be partly funded, we assume, by the near-$1bn net gain it expects to absorb from the sale of its Spotify shares.
The EMI deal, if it gets through European regulators, will give Sony 90% ownership of EMP – valuing the latter company, when debt is factored in, at some $4.75bn.
That, to put into perspective the rampant nature of the current music rights market, represents a 19-times multiple on EMP’s EBITDA of $249m in the 12 months to end of March 2018.
It also represents a 26-times multiple on the $181m operating income the firm posted in the same period.
Eye-watering stuff.
But where does the buyout promise to leave Sony in terms of its market power?
In short: as global king of music publishing – but not quite global king of all music rights combined.

Before we begin the mathematical fun below, here’s the key stat: according to Sony Corp’s announcement last week, EMI Music Publishing generated revenues of $663m in Sony’s FY2017 – ie. the year to end of March 2018.
This is handy, because we already know what Sony Corp’s music divisions turned over in USD in this period. (See the end of this article for a simply fascinating explanation on the currency conversion tactics we’ve used throughout this analysis.)
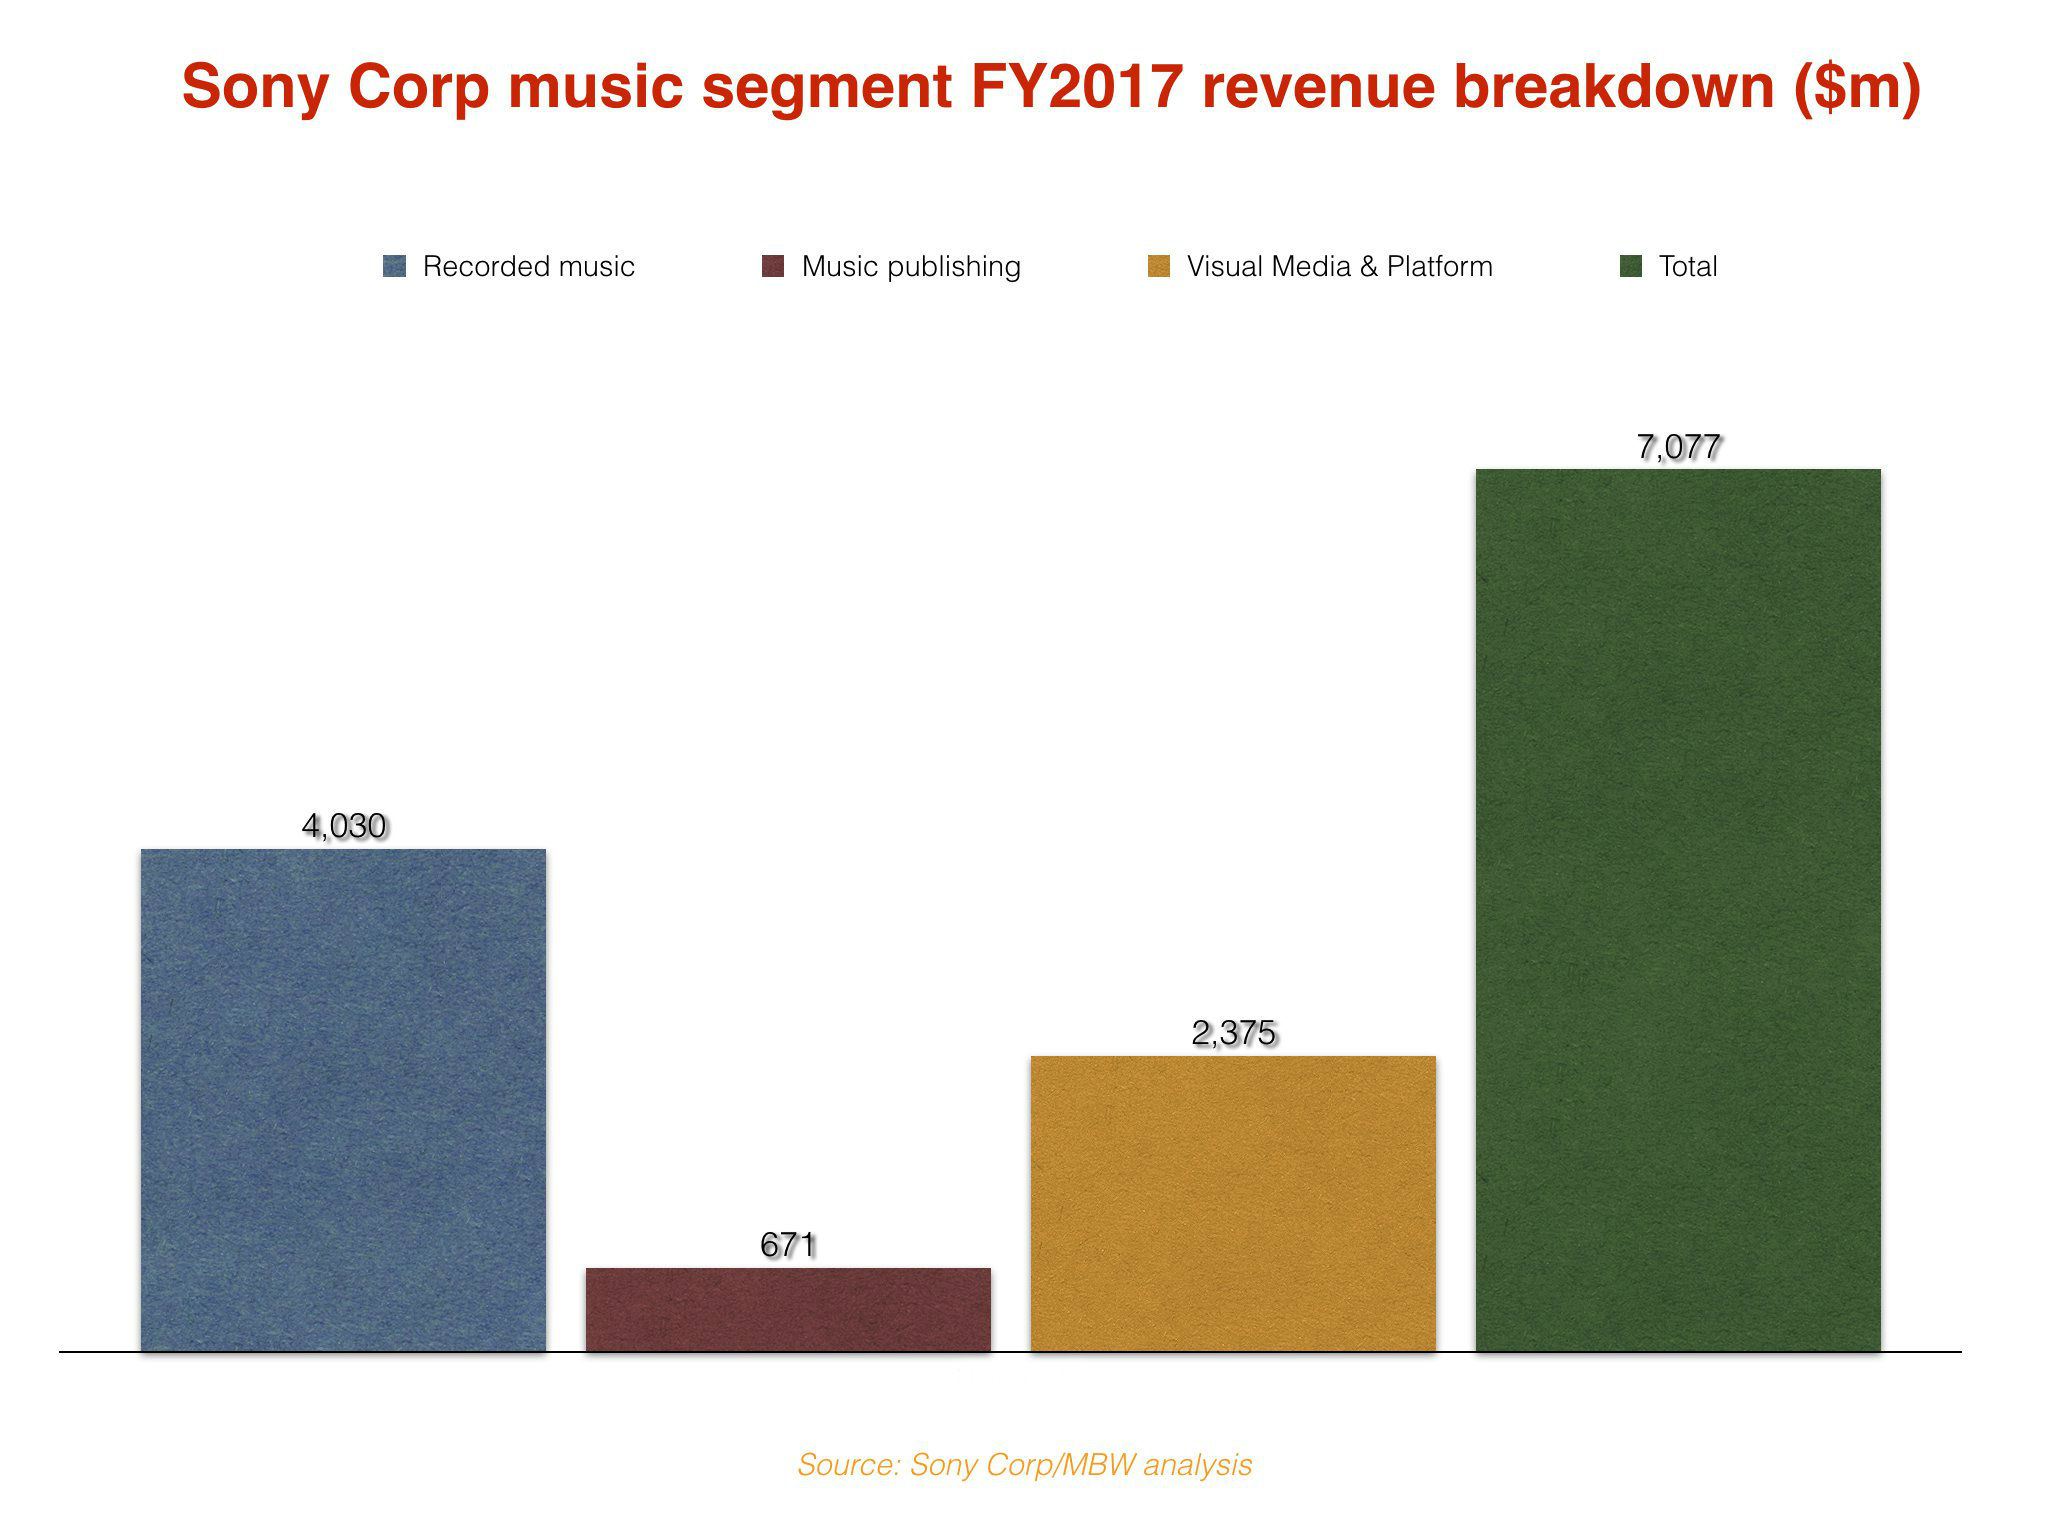
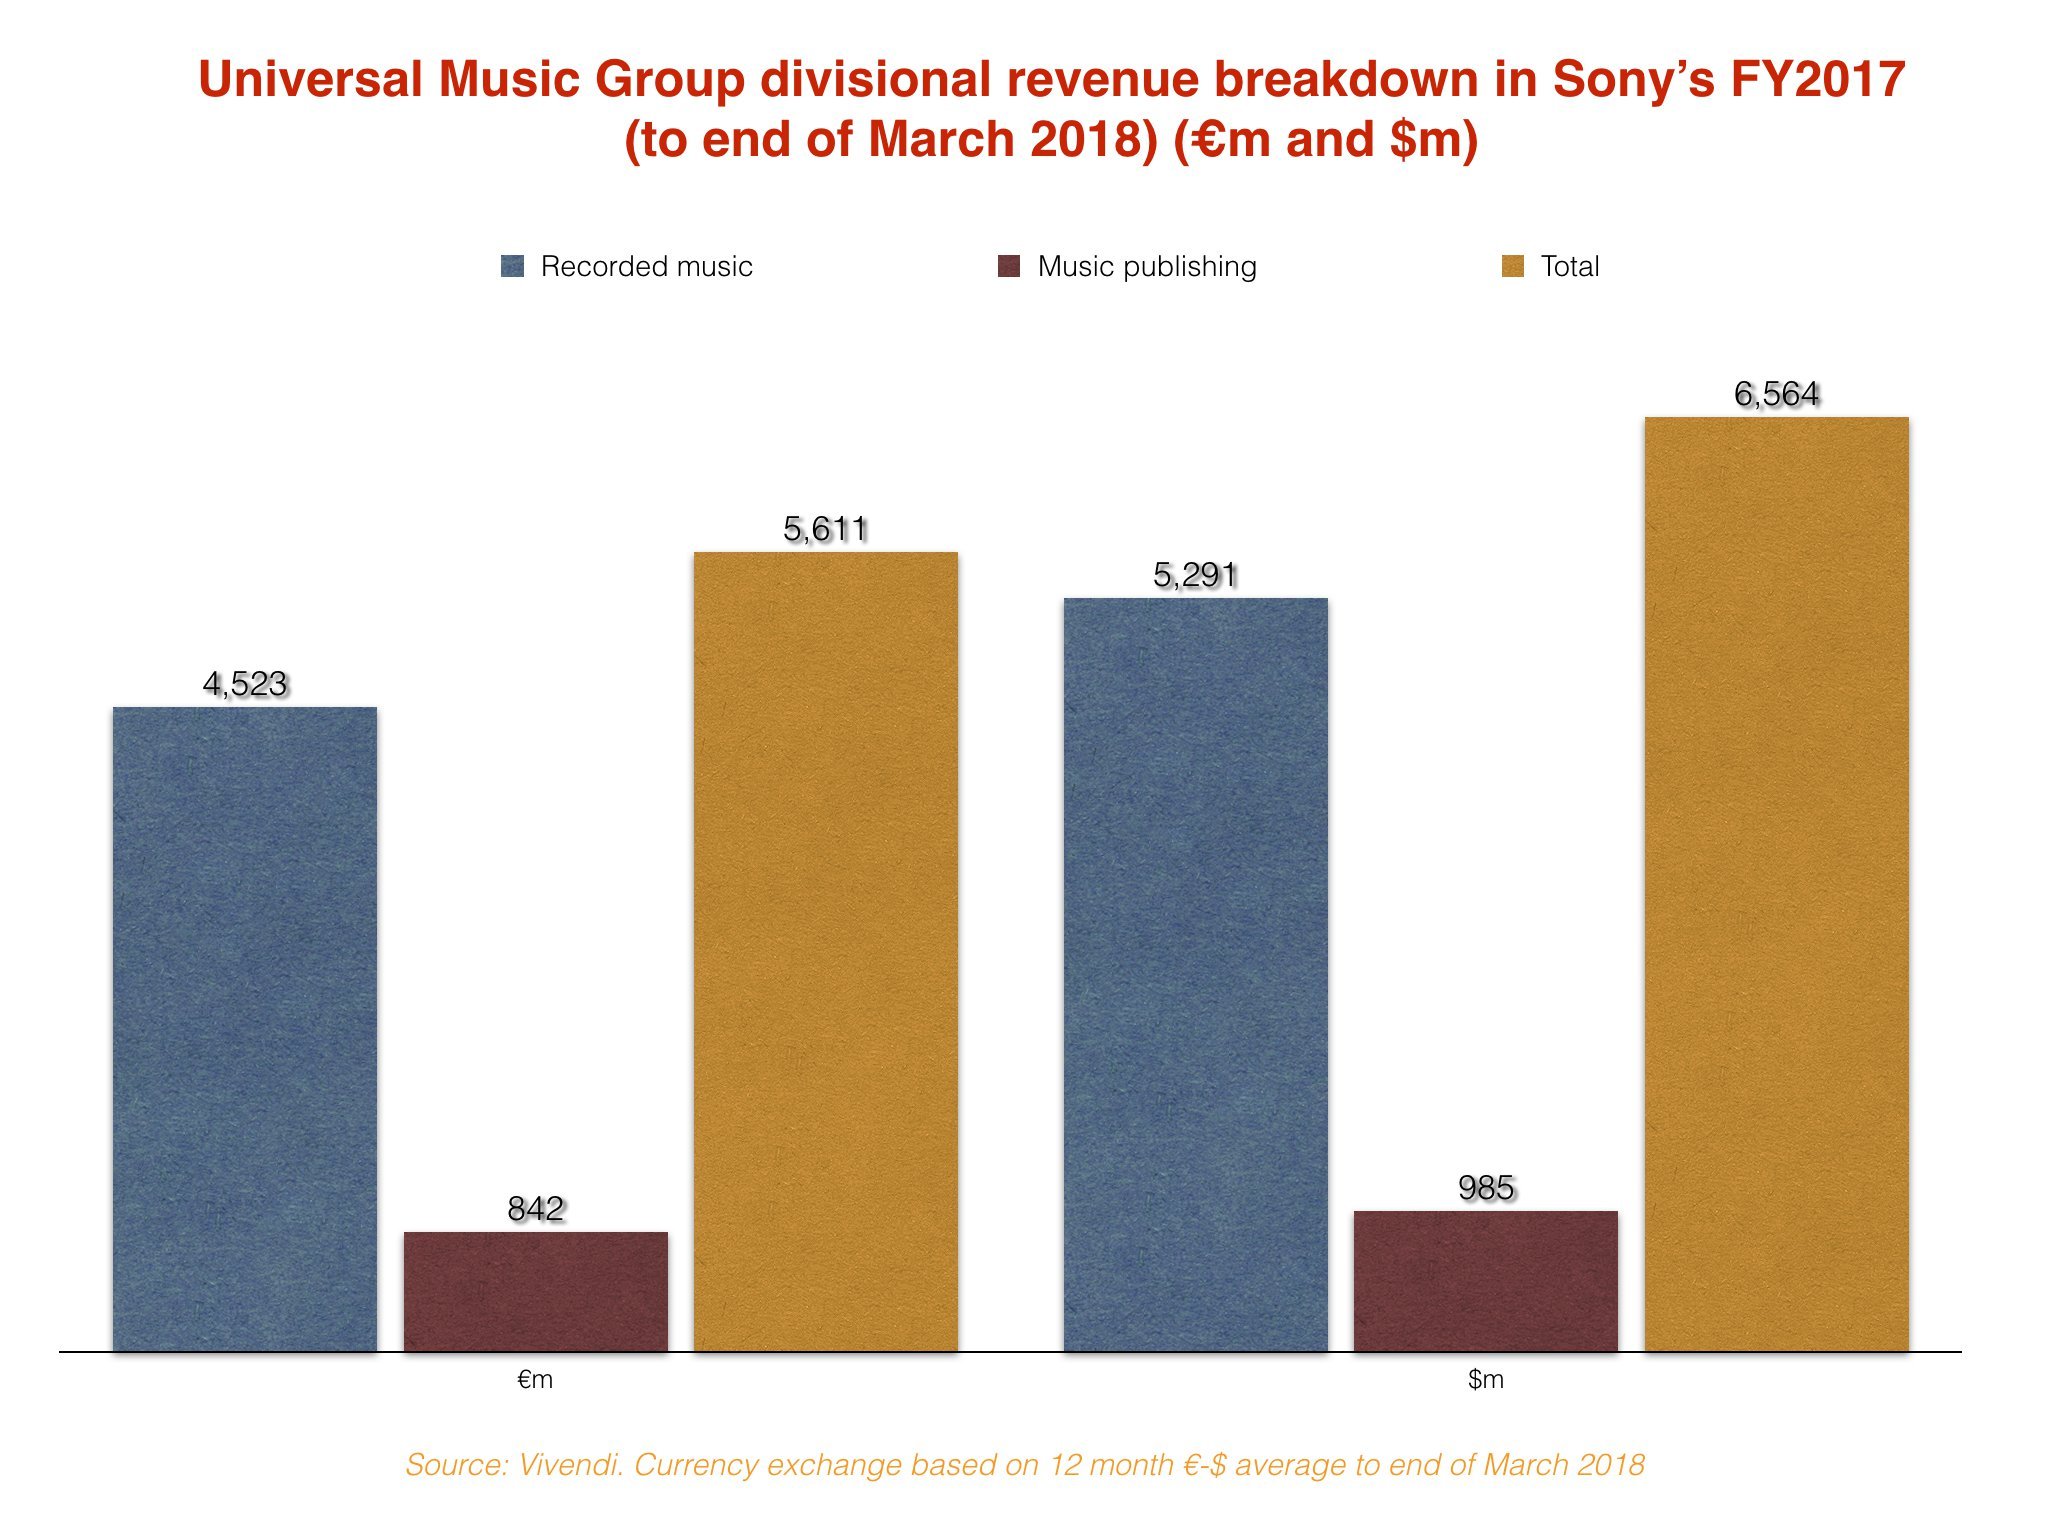
In short, here’s how Sony’s recorded music, music publishing and ‘Visual Media & Platform’ divisions did in revenues terms in its last FY, judged in USD.
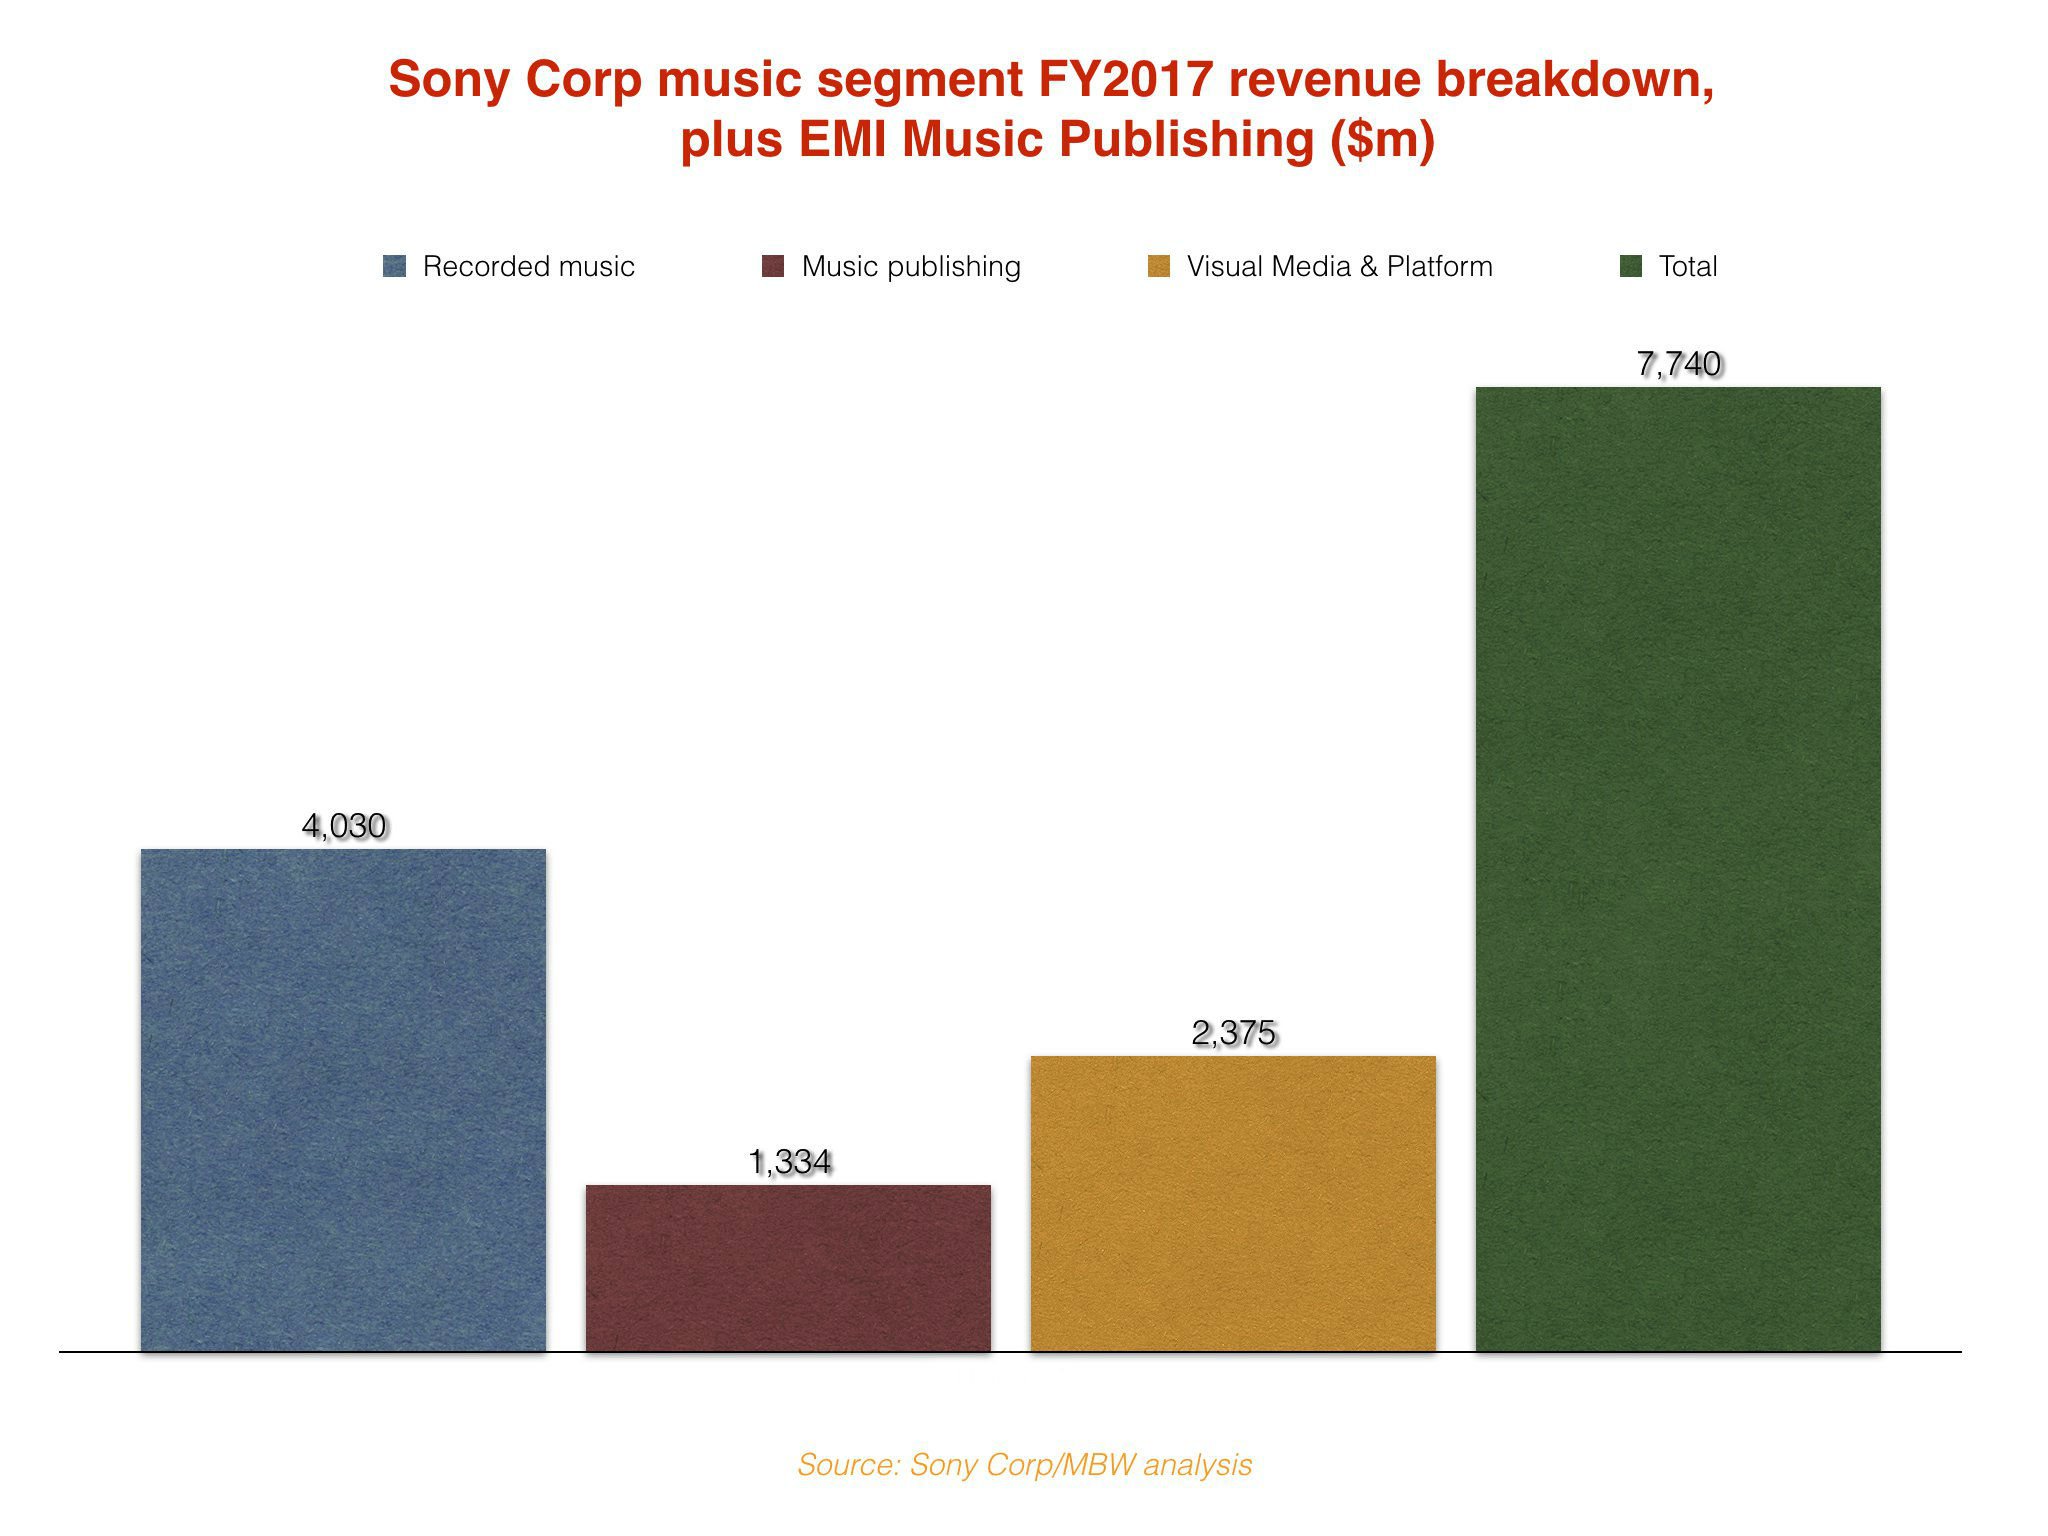
And here’s how the revenues of Sony Corp’s music division would have looked in FY 2017 (again, to end of March this year) had the company owned the revenue from EMI Music Publishing in the period.
Now, before we get to the fun bit, a few bits of vital information:
- Despite previously owning 30% of EMI Music Publishing, and with its Sony/ATV being the admin partner for the company, Sony has never previously counted EMP’s revenues in its own sales numbers. (A portion of EMI’s performance has been recorded in Sony’s operating income, but we’re not looking at that here – just revenues.)
- What’s more, Sony’s ‘Visual Media & Platform’ division is, ahem, a questionable area of the firm’s ‘music’ revenue – based as it is on categories including anime and video games such as the runaway mobile smash Fate/Grand Order. (We have covered this quirk before, through here.)
- Therefore, for the purposes of a fair comparison to the other biggest music company in the market – ie. Universal Music Group – we’re going to omit VM&P’s $2.4bn of turnover in Sony’s FY2017 from the following number-crunching…
Fun bit!
Let’s take a look at how Vivendi-owned Universal Music Group’s revenue (in USD, converted from Euro) performed in the same period as Sony’s FY2017 – ie. the 12 months to end of March 2018.
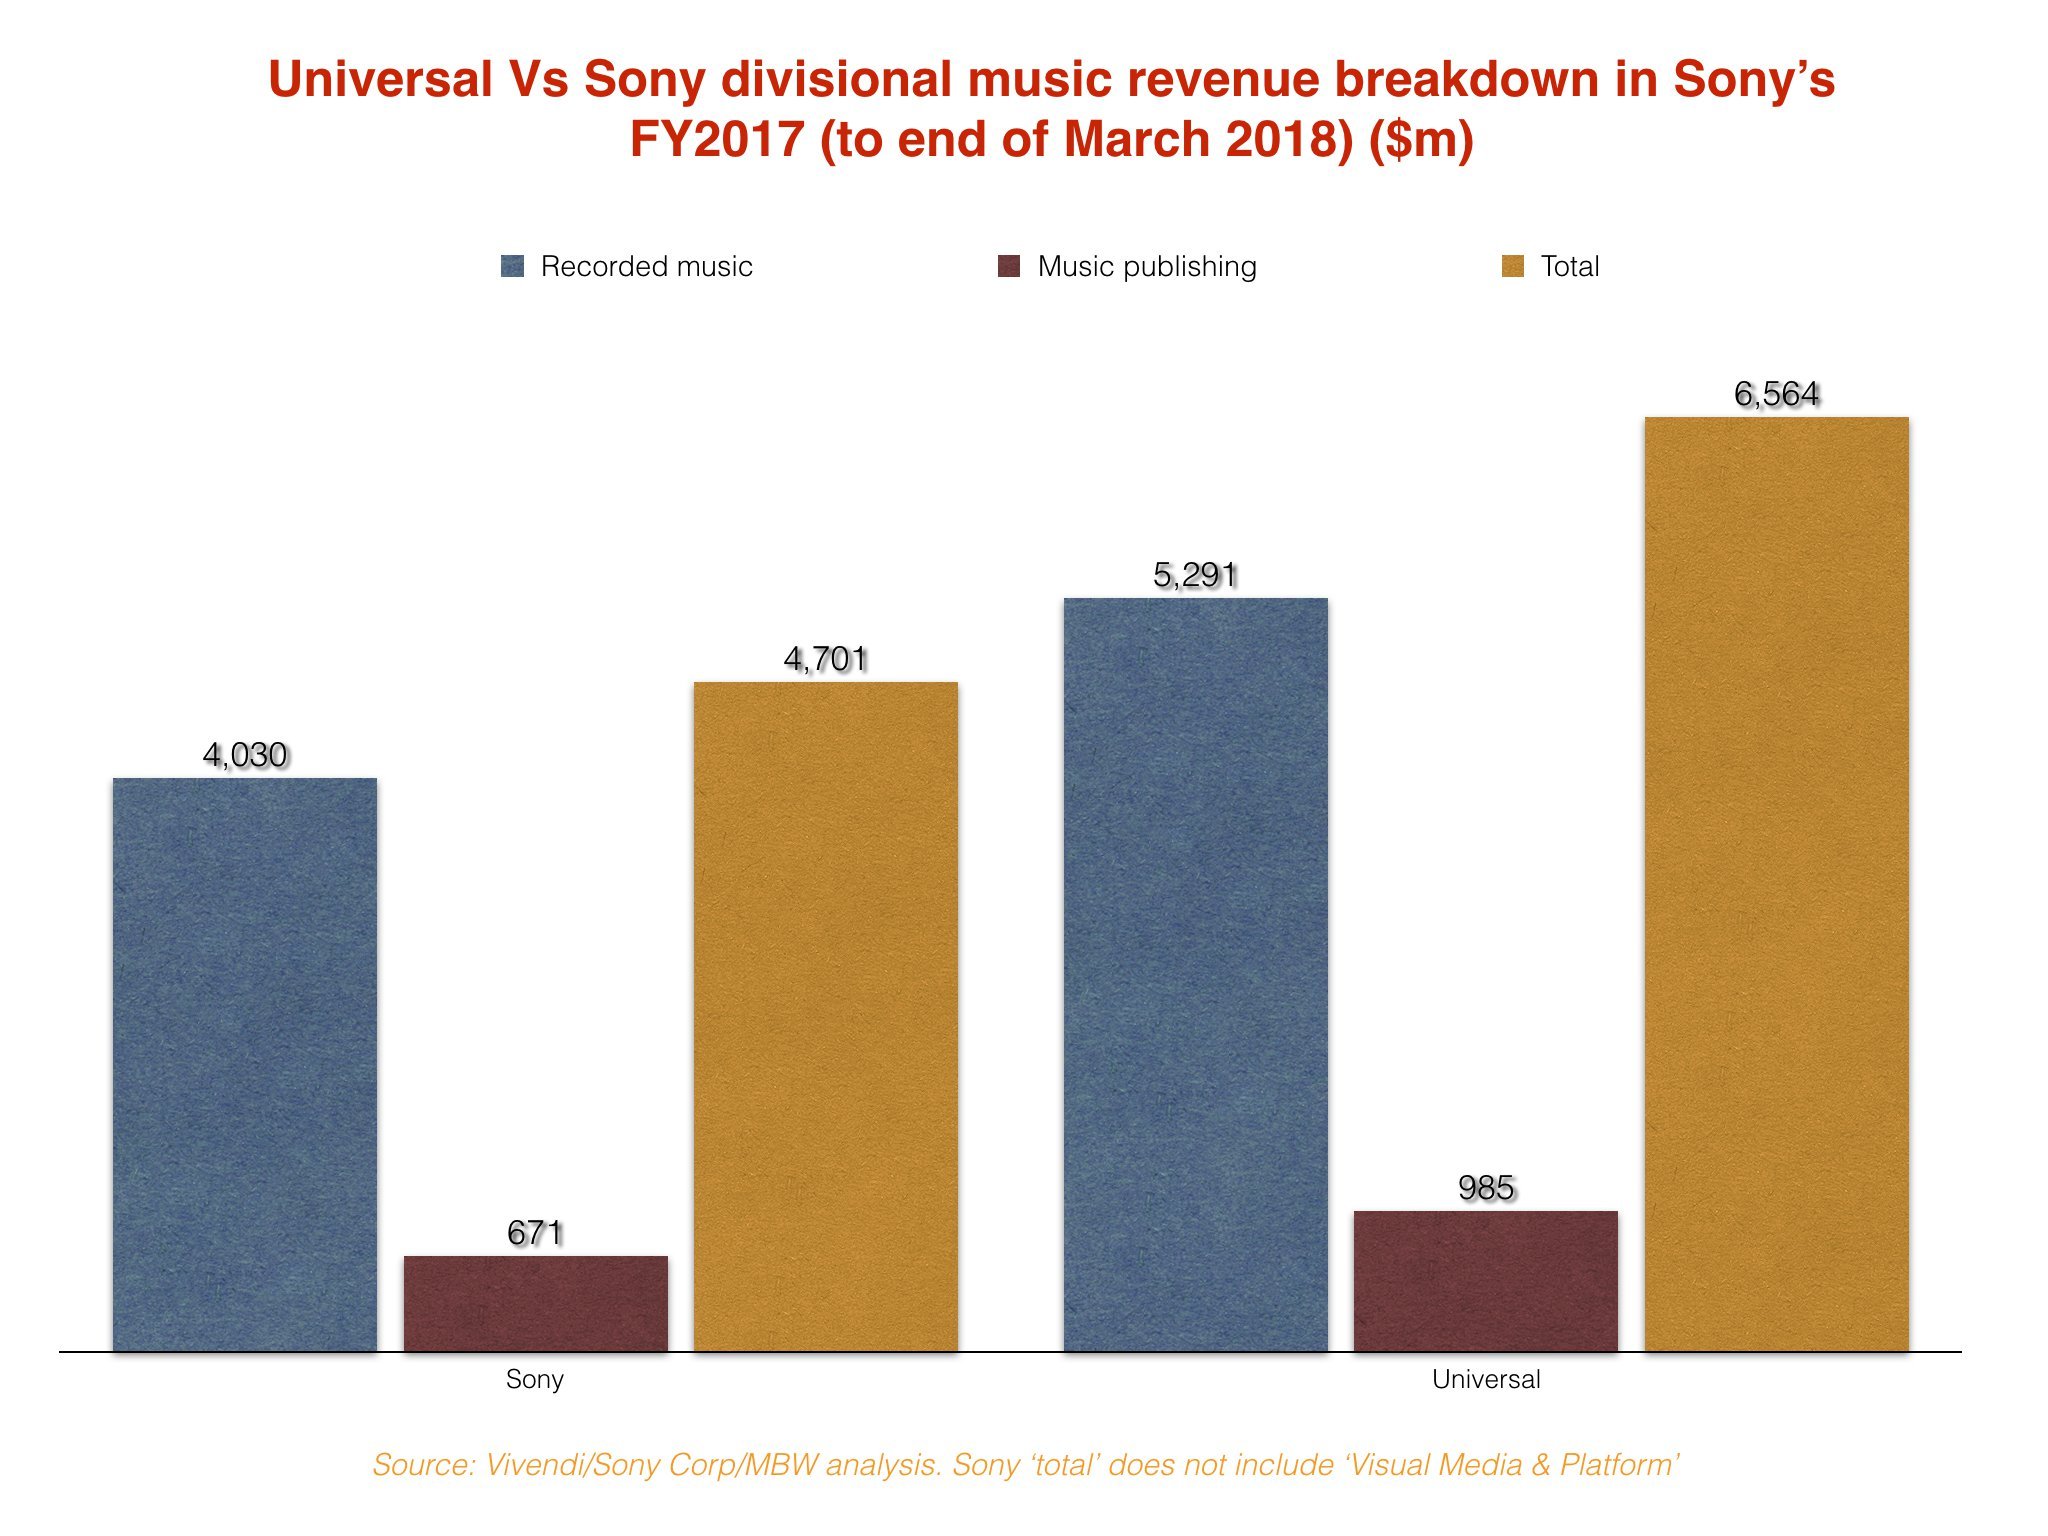
And, drum roll… now let’s put UMG and Sony side-by-side.
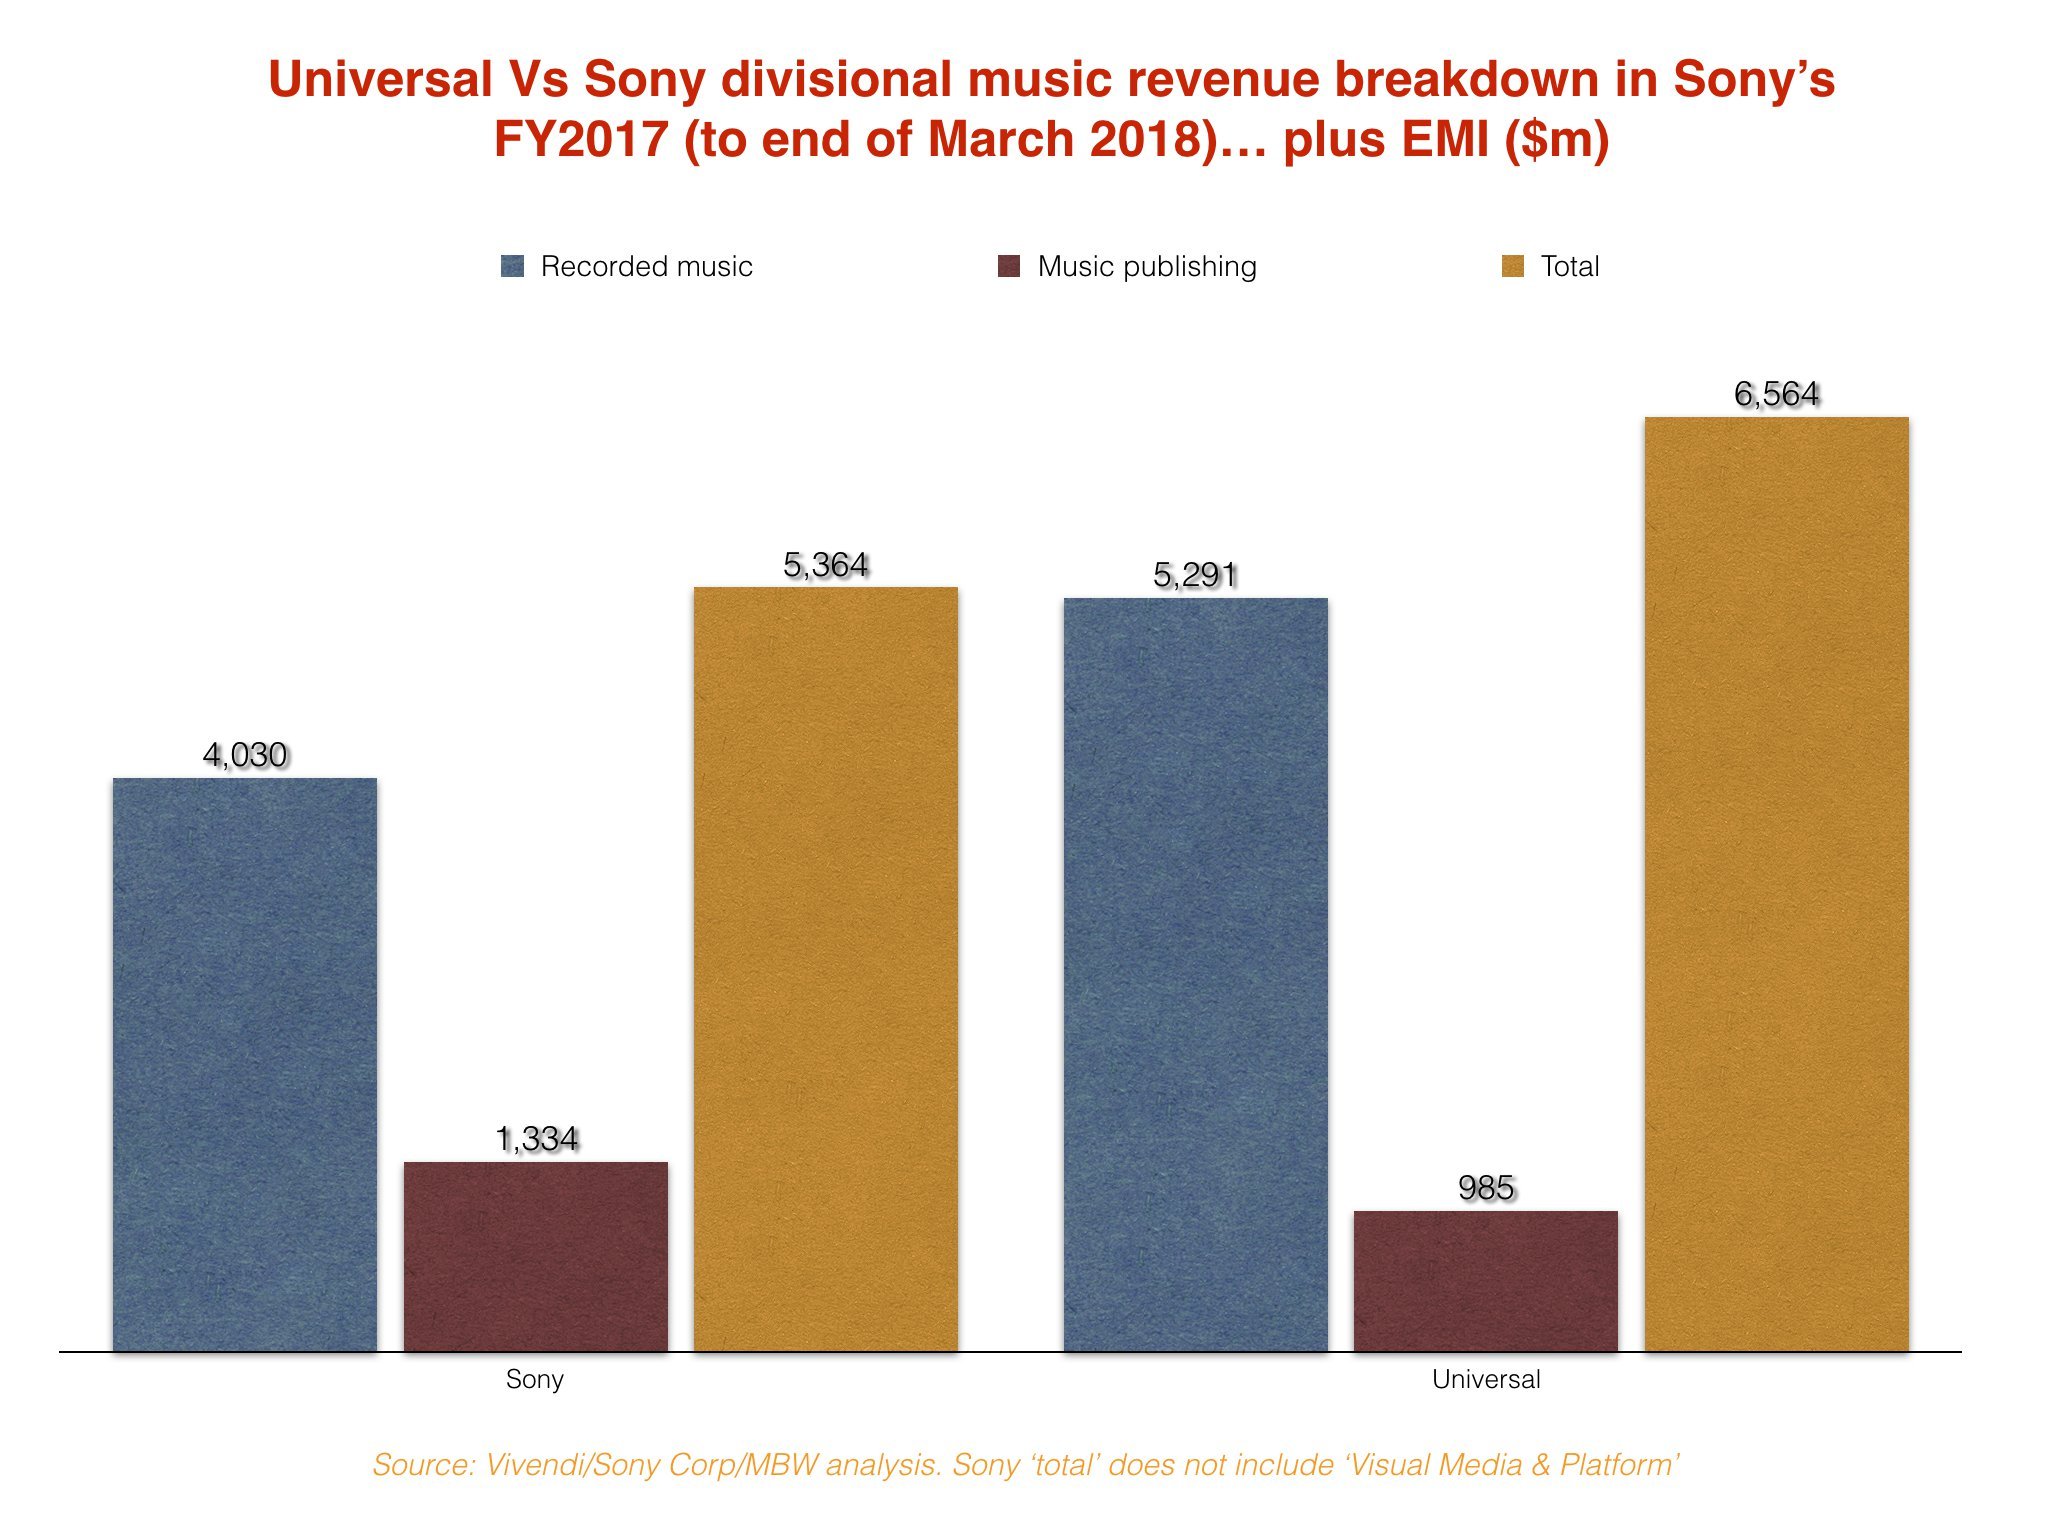
Below you can see how the two majors would have compared in Sony’s FY2017 – both in terms of what each company’s music operations actually turned over, and what Sony would have turned over had it also included EMI Music Publishing’s sales.
The key conclusions:
- In Sony Corp’s last fiscal year (to end of March), the company’s music publishing operation – which includes Sony/ATV and its sister company in Japan – turned over the equivalent of $671m. In the same period, Universal Music Publishing Group turned over $985m;
- However, if EMI Music Publishing’s revenues in the period were added to Sony Corp’s publishing haul, Sony would have become by far the biggest global publisher – turning over $349m more than UMPG across the 12 months;
- The addition of EMP’s $663m in revenue to Sony’s FY2017 would have taken the company’s total music sales to $5.36bn (including recorded music and publishing, but not including VM&P). That’s clearly a significant jump on the $4.7bn Sony turned over across publishing and records in the same period without EMP;
- However, it wouldn’t have been enough to stop Universal’s total global sales (again, across publishing and records) being $1.2bn bigger in the 12 months, at $6.56bn.
- The controversial bit: Sony Corp may claim that ‘Visual Media & Platform‘ is a key part of its Music segment, and should therefore be included in these numbers (despite it not having very much to do with music). If VM&P numbers were added into the above, Sony’s ‘music’ division would have ended its FY2017 with $7.74bn turnover – almost $1.2bn bigger than Universal’s haul in the year.
- Phew!
(Update: Sources suggest that, although not explicitly declared, Sony may have included a $45m admin fee from EMP in its FY2017 results. This potentially should be deducted from the above figures, which would leave Sony + EMI with a very slightly smaller combined turnover of $5.31bn, with Sony’s publishing operation on $1.29bn.)
A NOTE ON CURRENCY EXCHANGE
In order to achieve an apples-to-apple comparison, both Sony and Universal’s performance in the 12 months to end of March 2018 have been converted out of their root currencies (Yen and Euros, respectively) at prevailing annual exchange rates.
In Sony Corp’s case, this was taken from the Japanese company’s own FY year-end financials, which suggest a $1 = ¥110.9 annual rate.
In Vivendi-owned Universal’s case, this was taken from currency specialists OANDA who, for the 12 months to end of March 2018, calculated a rate of $1 = €1.17.
This isn’t a perfect system – not least because of some heavy movement in currency quarter-to-quarter in calendar Q1 this year. But it’s a good approximation, and allows a direct annual comparison of the two companies.
The above analysis refers only to corporate level results – on an industry level, as an admin partner, Sony/ATV already counts EMI’s performance in its market share.
Oh, and the section from Sony’s financials explaining that EMP’s revenues are largely omitted from its previous music revenue reports goes a little something like this:
‘The Music segment results include the yen-translated results of Sony Music Entertainment and Sony/ATV Music Publishing, both U.S.-based operations which aggregate the results of their worldwide subsidiaries on a U.S. dollar basis, and the results of Sony Music Entertainment (Japan) Inc., a Japan-based music company which aggregates its results in yen. The segment also includes equity in net income (loss) for EMI Music Publishing (“EMI”), an affiliated company accounted for under the equity method for which Sony records 39.8% of EMI’s net income in the segment operating income.’

Music Business Worldwide