Yesterday brought with it the annual IFPI numbers on the global music industry’s wholesale trade revenues of 2017 – and very pleasing they were, too.
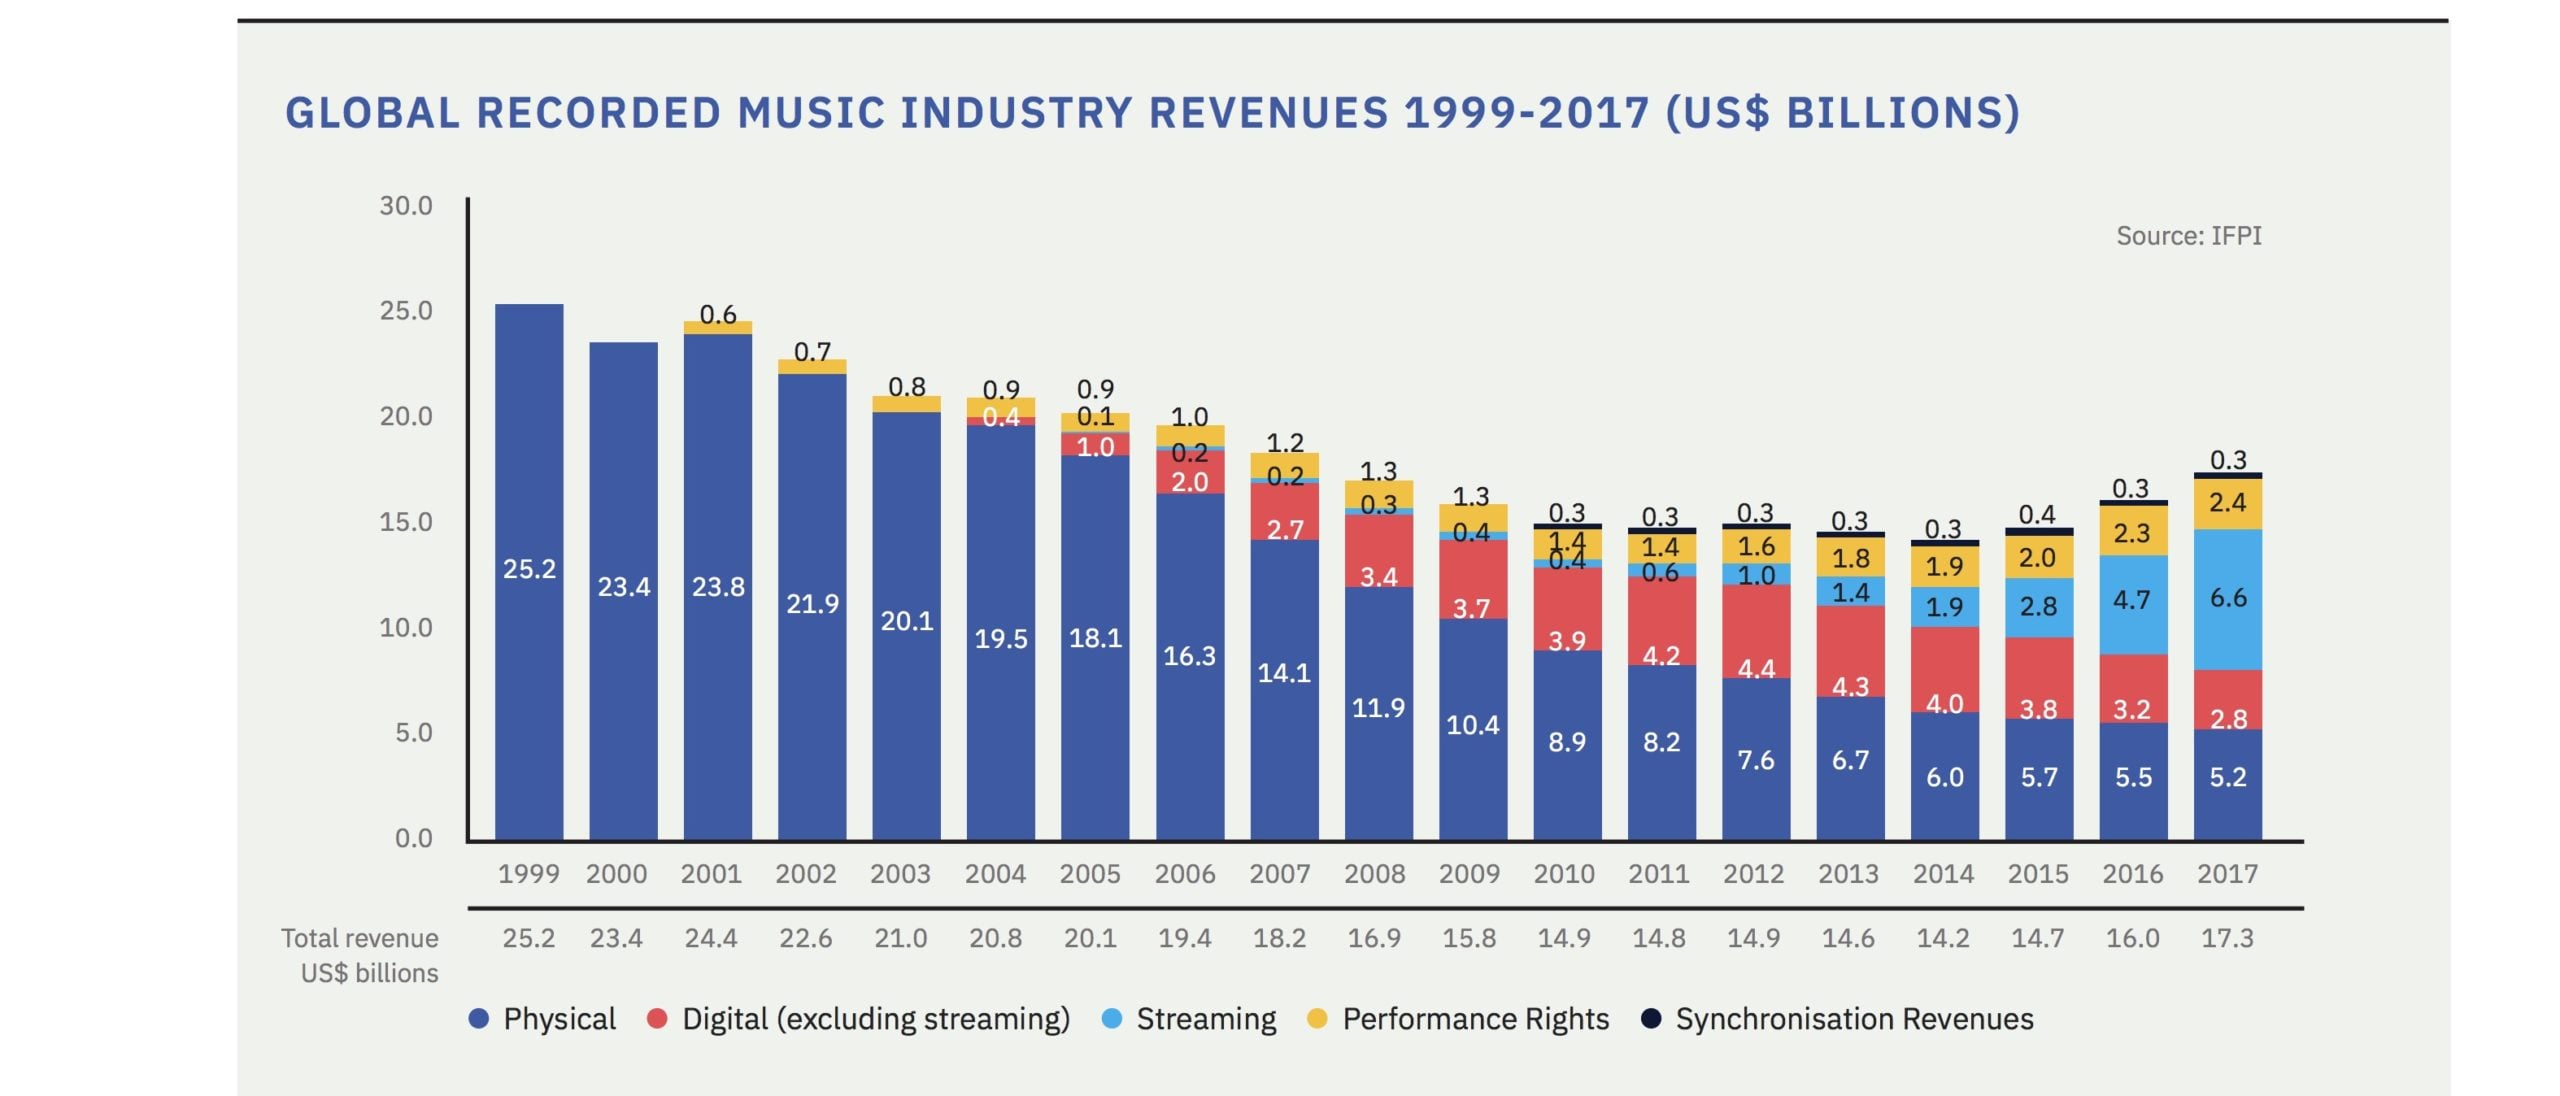
If you missed the key facts: worldwide money sloshing its way back to artists and labels in the year amounted to $17.3bn, up 8.1% year-on-year.
That $17.3bn stat is very useful when it comes to working out who had the biggest year in 2017 across the global recorded music business – including both the majors, and the independents.
It means we can figure out, on a distribution basis, exactly who owned what in terms of market share.
The numbers are sure to cause a lot of discussion across the industry…
Before all of that… a bit of numerical housekeeping: in its 2018 Global Music Report (in the fine print at the back), the IFPI confirms that it converts currency into USD $ ‘on an annual basis’, using data from the good people over at OANDA.
This splendid news for MBW, because that’s exactly how we calculate currency conversion, too: on an average annualized basis (in this case at the prevalent rates in 2016 and 2017), based on OANDA data. Here goes.
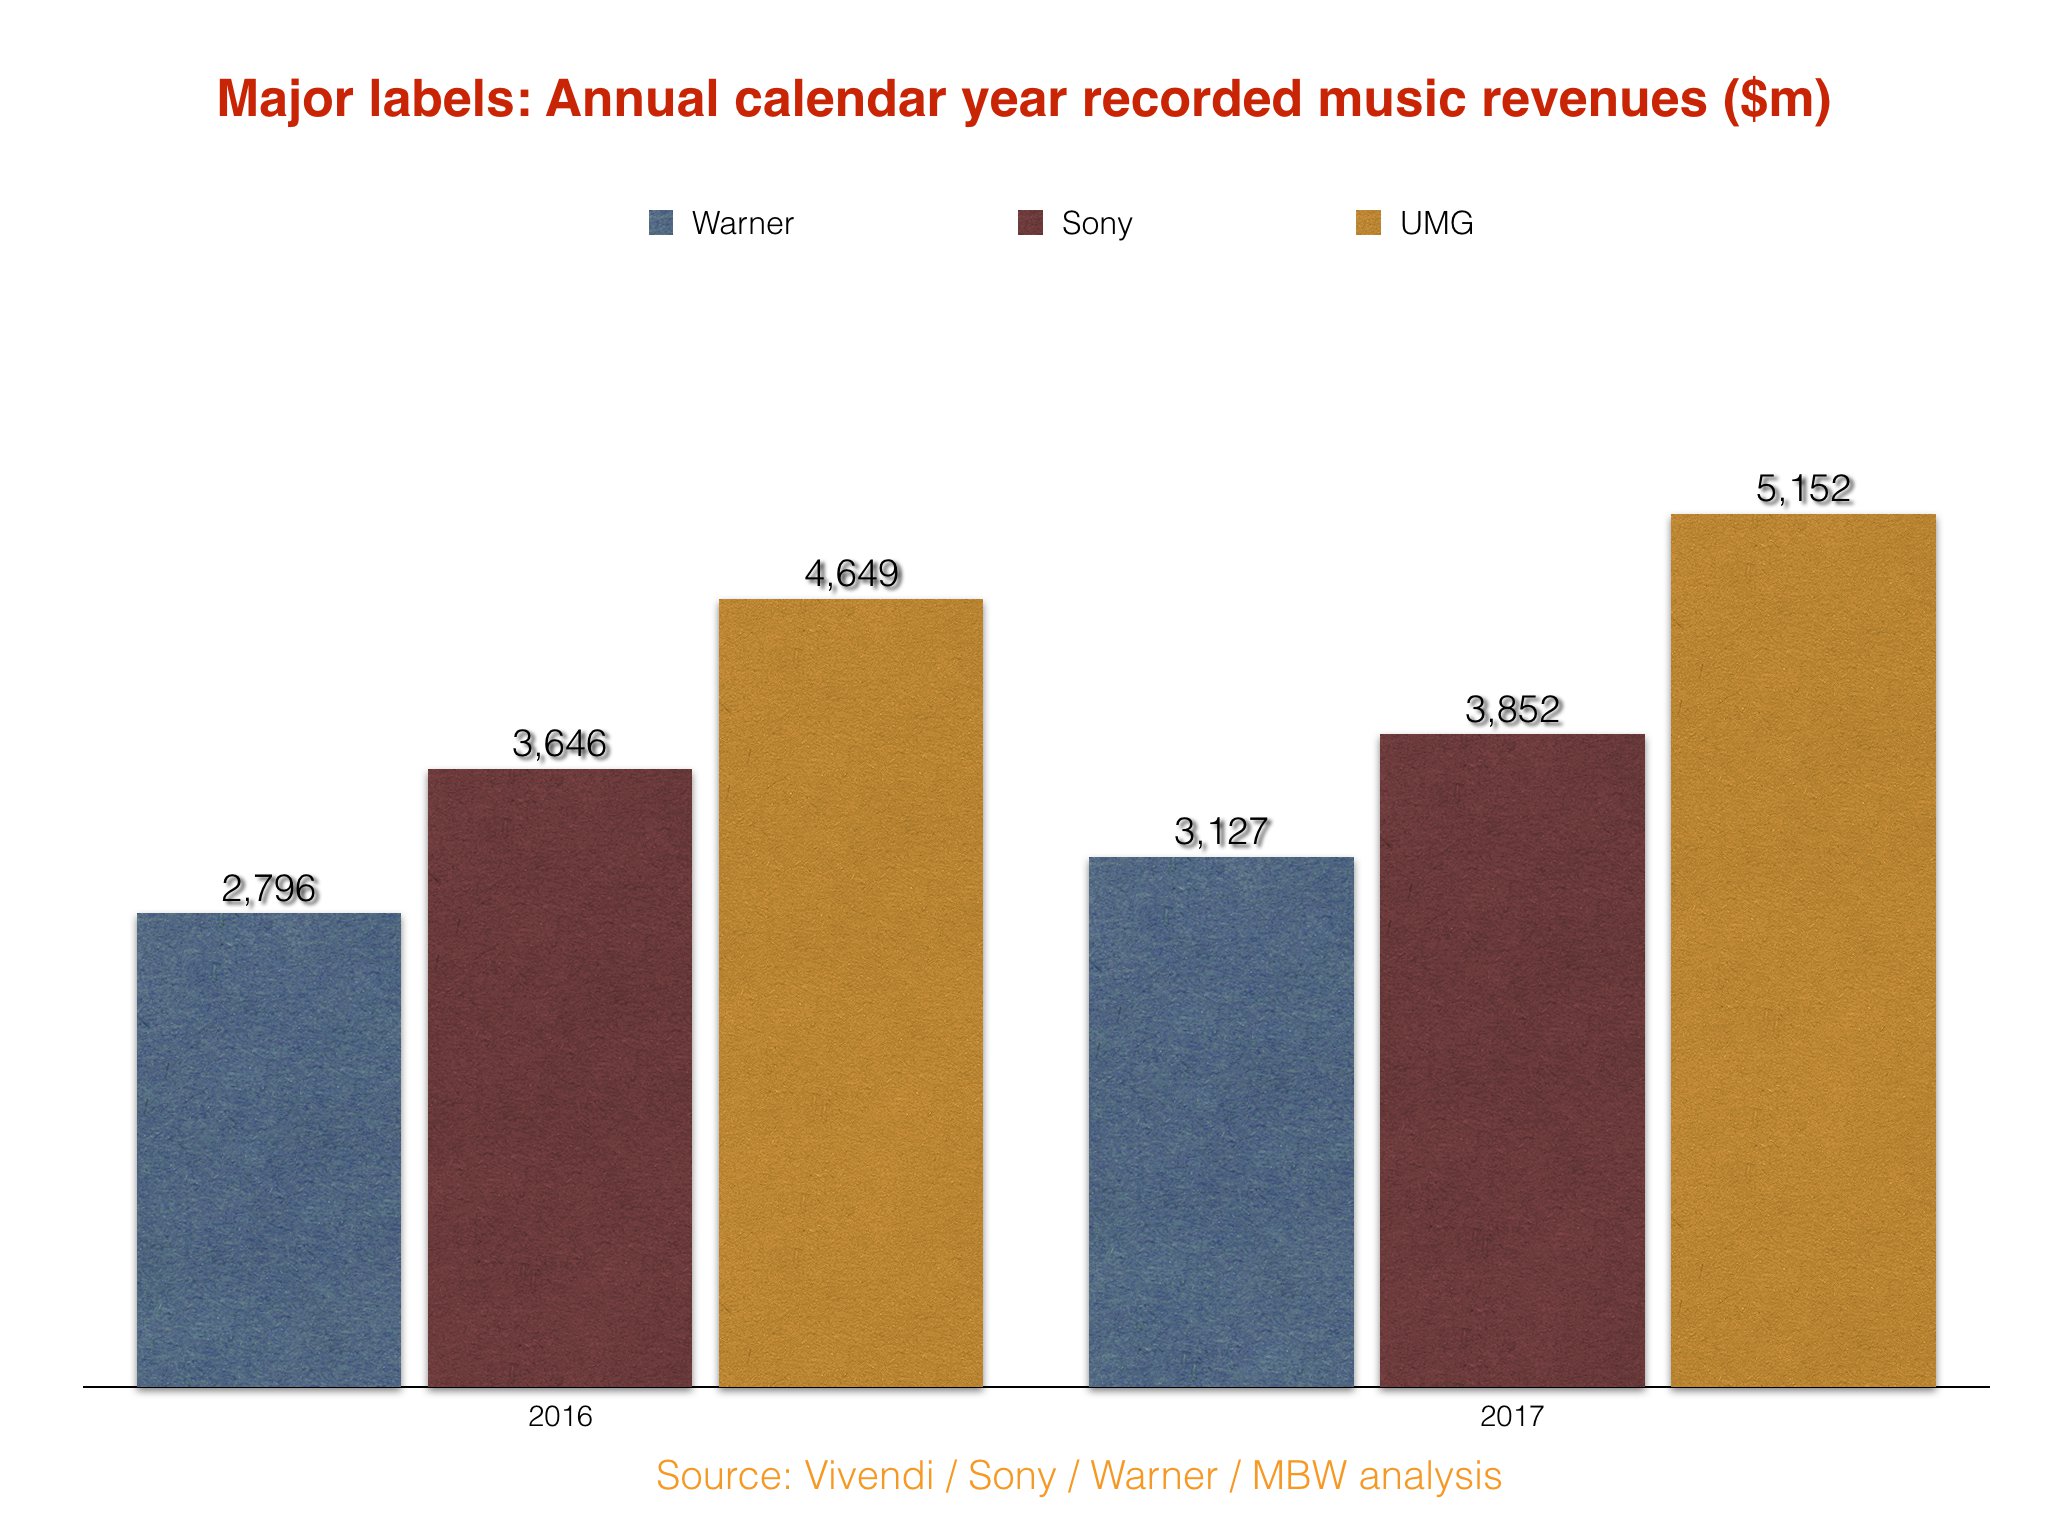
These calendar year figures were based on quarterly company filings in France (Vivendi), Japan (Sony Corp) and the United States (Warner Music Group).
Now, thanks to the IFPI, we can work out how these numbers fit into the total worldwide industry – and calculate the value of the non-major (ie. independent) market share over the past two years.
The sum required to work that out for 2017 is pretty straightforward:$17.3bn – (UMG’s $5.15bn + Sony’s $3.85bn + Warner’s $3.13bn) = the indies’ share.
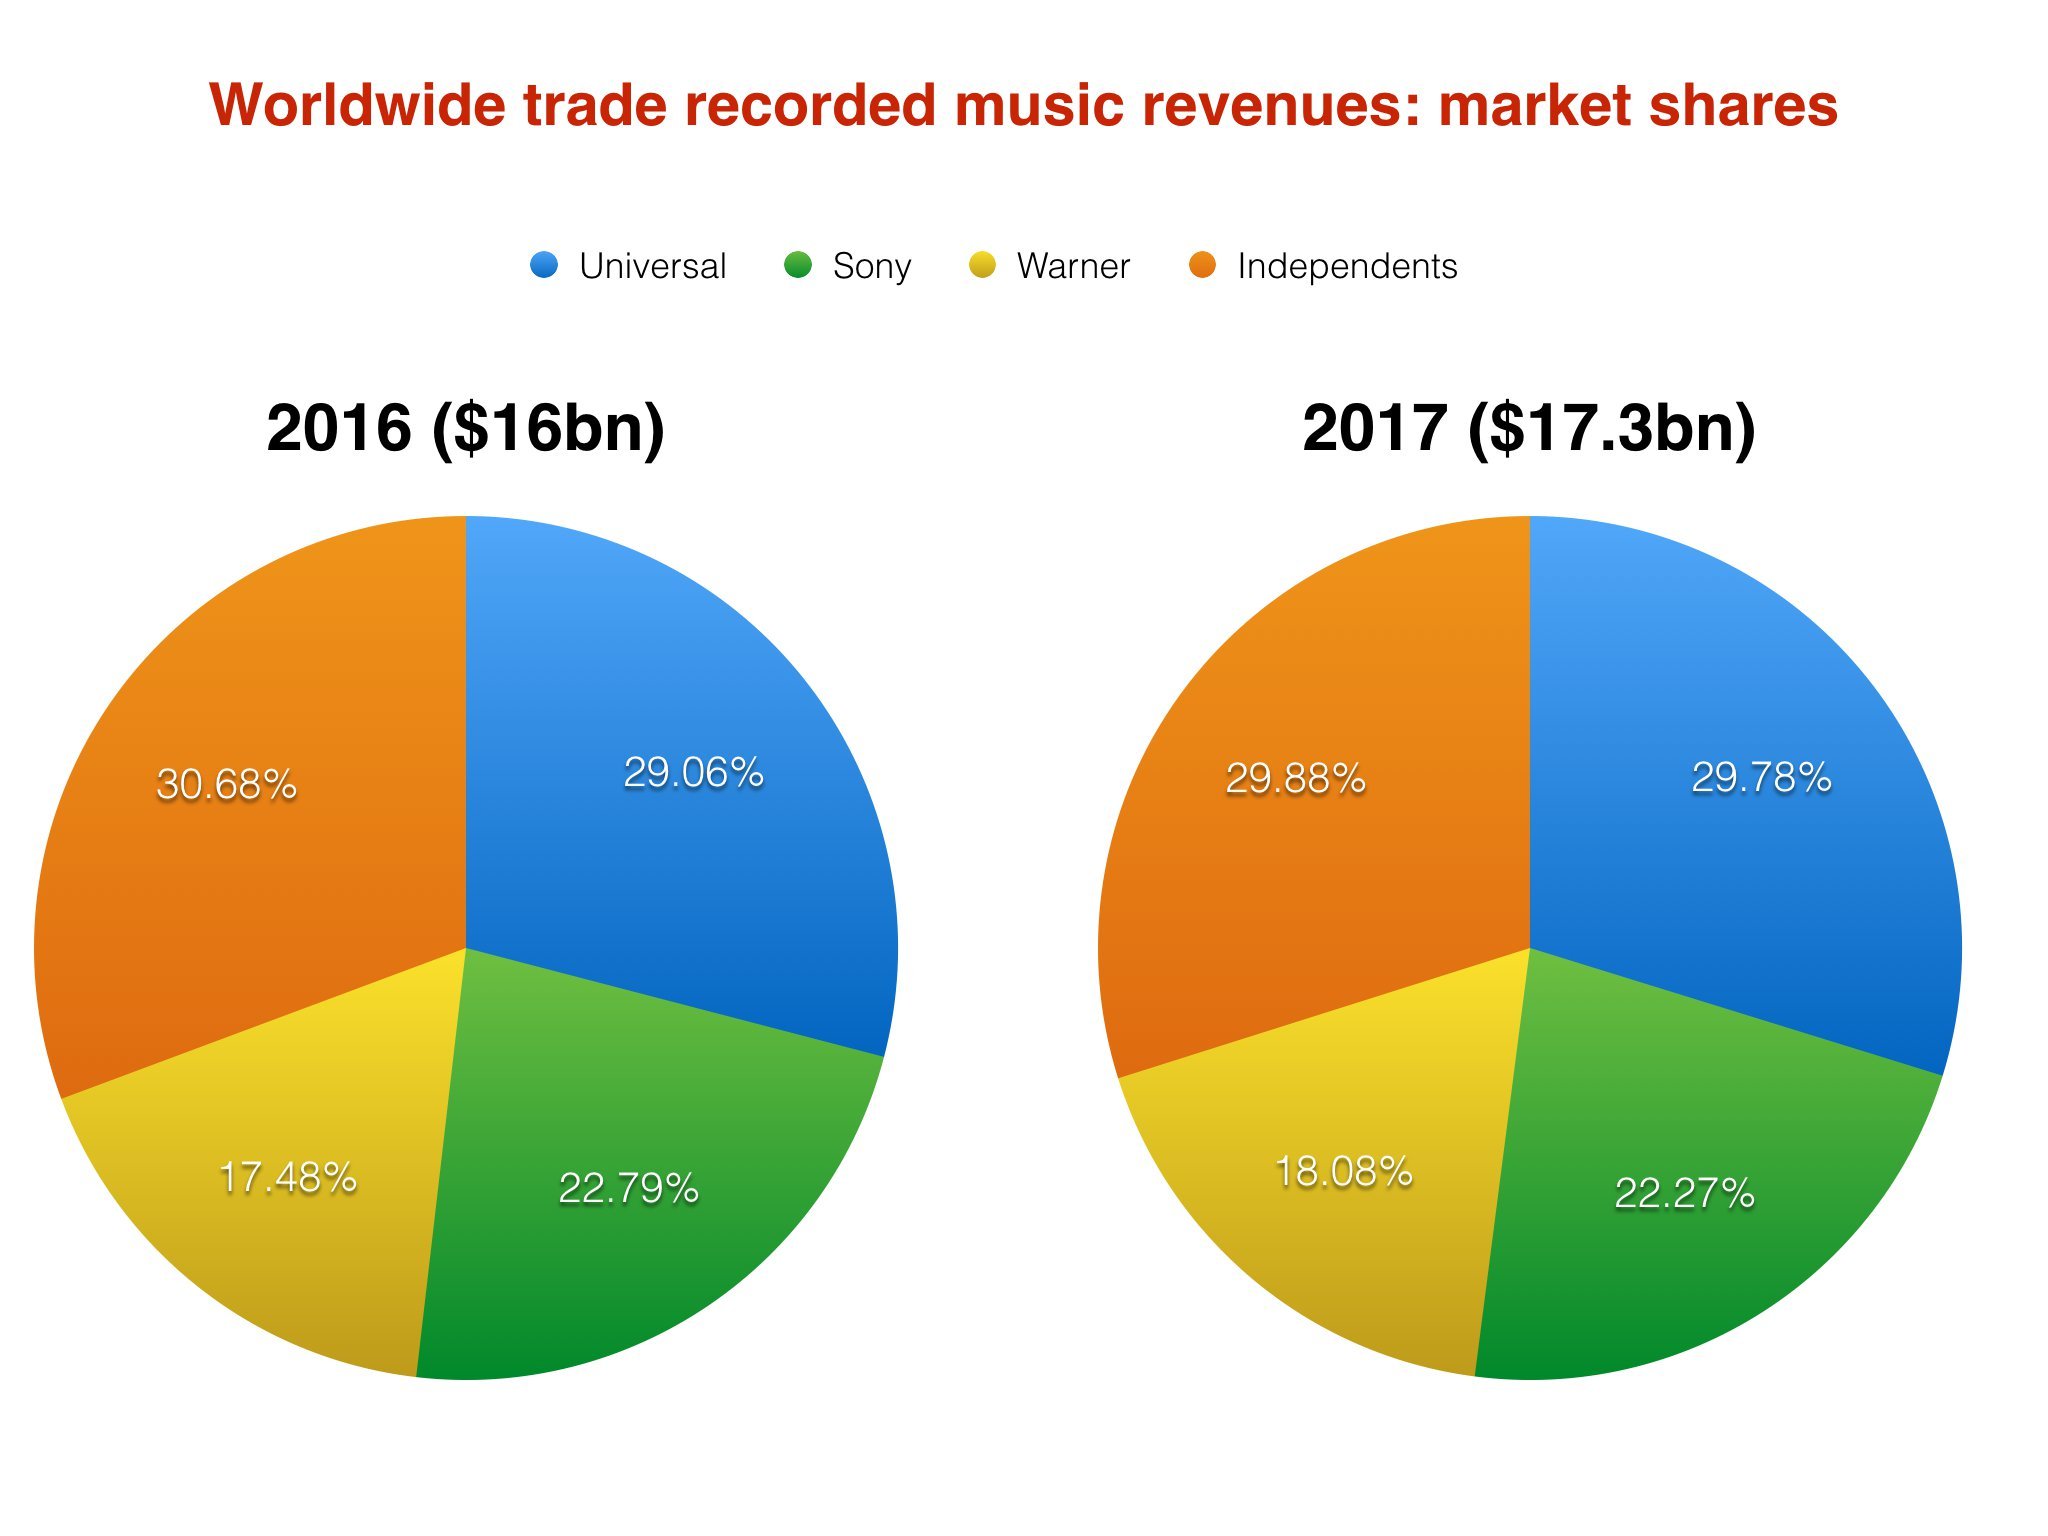
The remainder there, aka. the independent sector share last year, is $5.17bn, or 29.88% of the overall pie.
In 2016, the equivalent figures for the independents were $4.91bn, or 30.68%.
The really good news for the independent sector, then: despite its market share falling slightly year-on-year (from 30.68% to 29.88%), it was actually the biggest player in the global recorded music market in 2017, slightly ahead of Universal (29.88% vs. 29.78%).
As has been pointed out by Midia’s Research’s Mark Mulligan, this wasn’t just independent labels: independent (ie. self-releasing) artists also contributed a portion of this independent market share.
We can’t know for sure what figure the IFPI puts on this sector as it’s not singled out within its report.
But we do know this: if we go off Midia’s estimated self-releasing artist revenue figure in 2017 ($472m), it results in a 2.73% market share of the IFPI’s $17.3bn total.
That, in turn, reduces the share of the remainder of the rest of the independent sector (ie. indie labels) down to $4.43bn, or 27.15%.
Streaming recorded music
Here’s where things get even more controversial – not least for the streaming services.
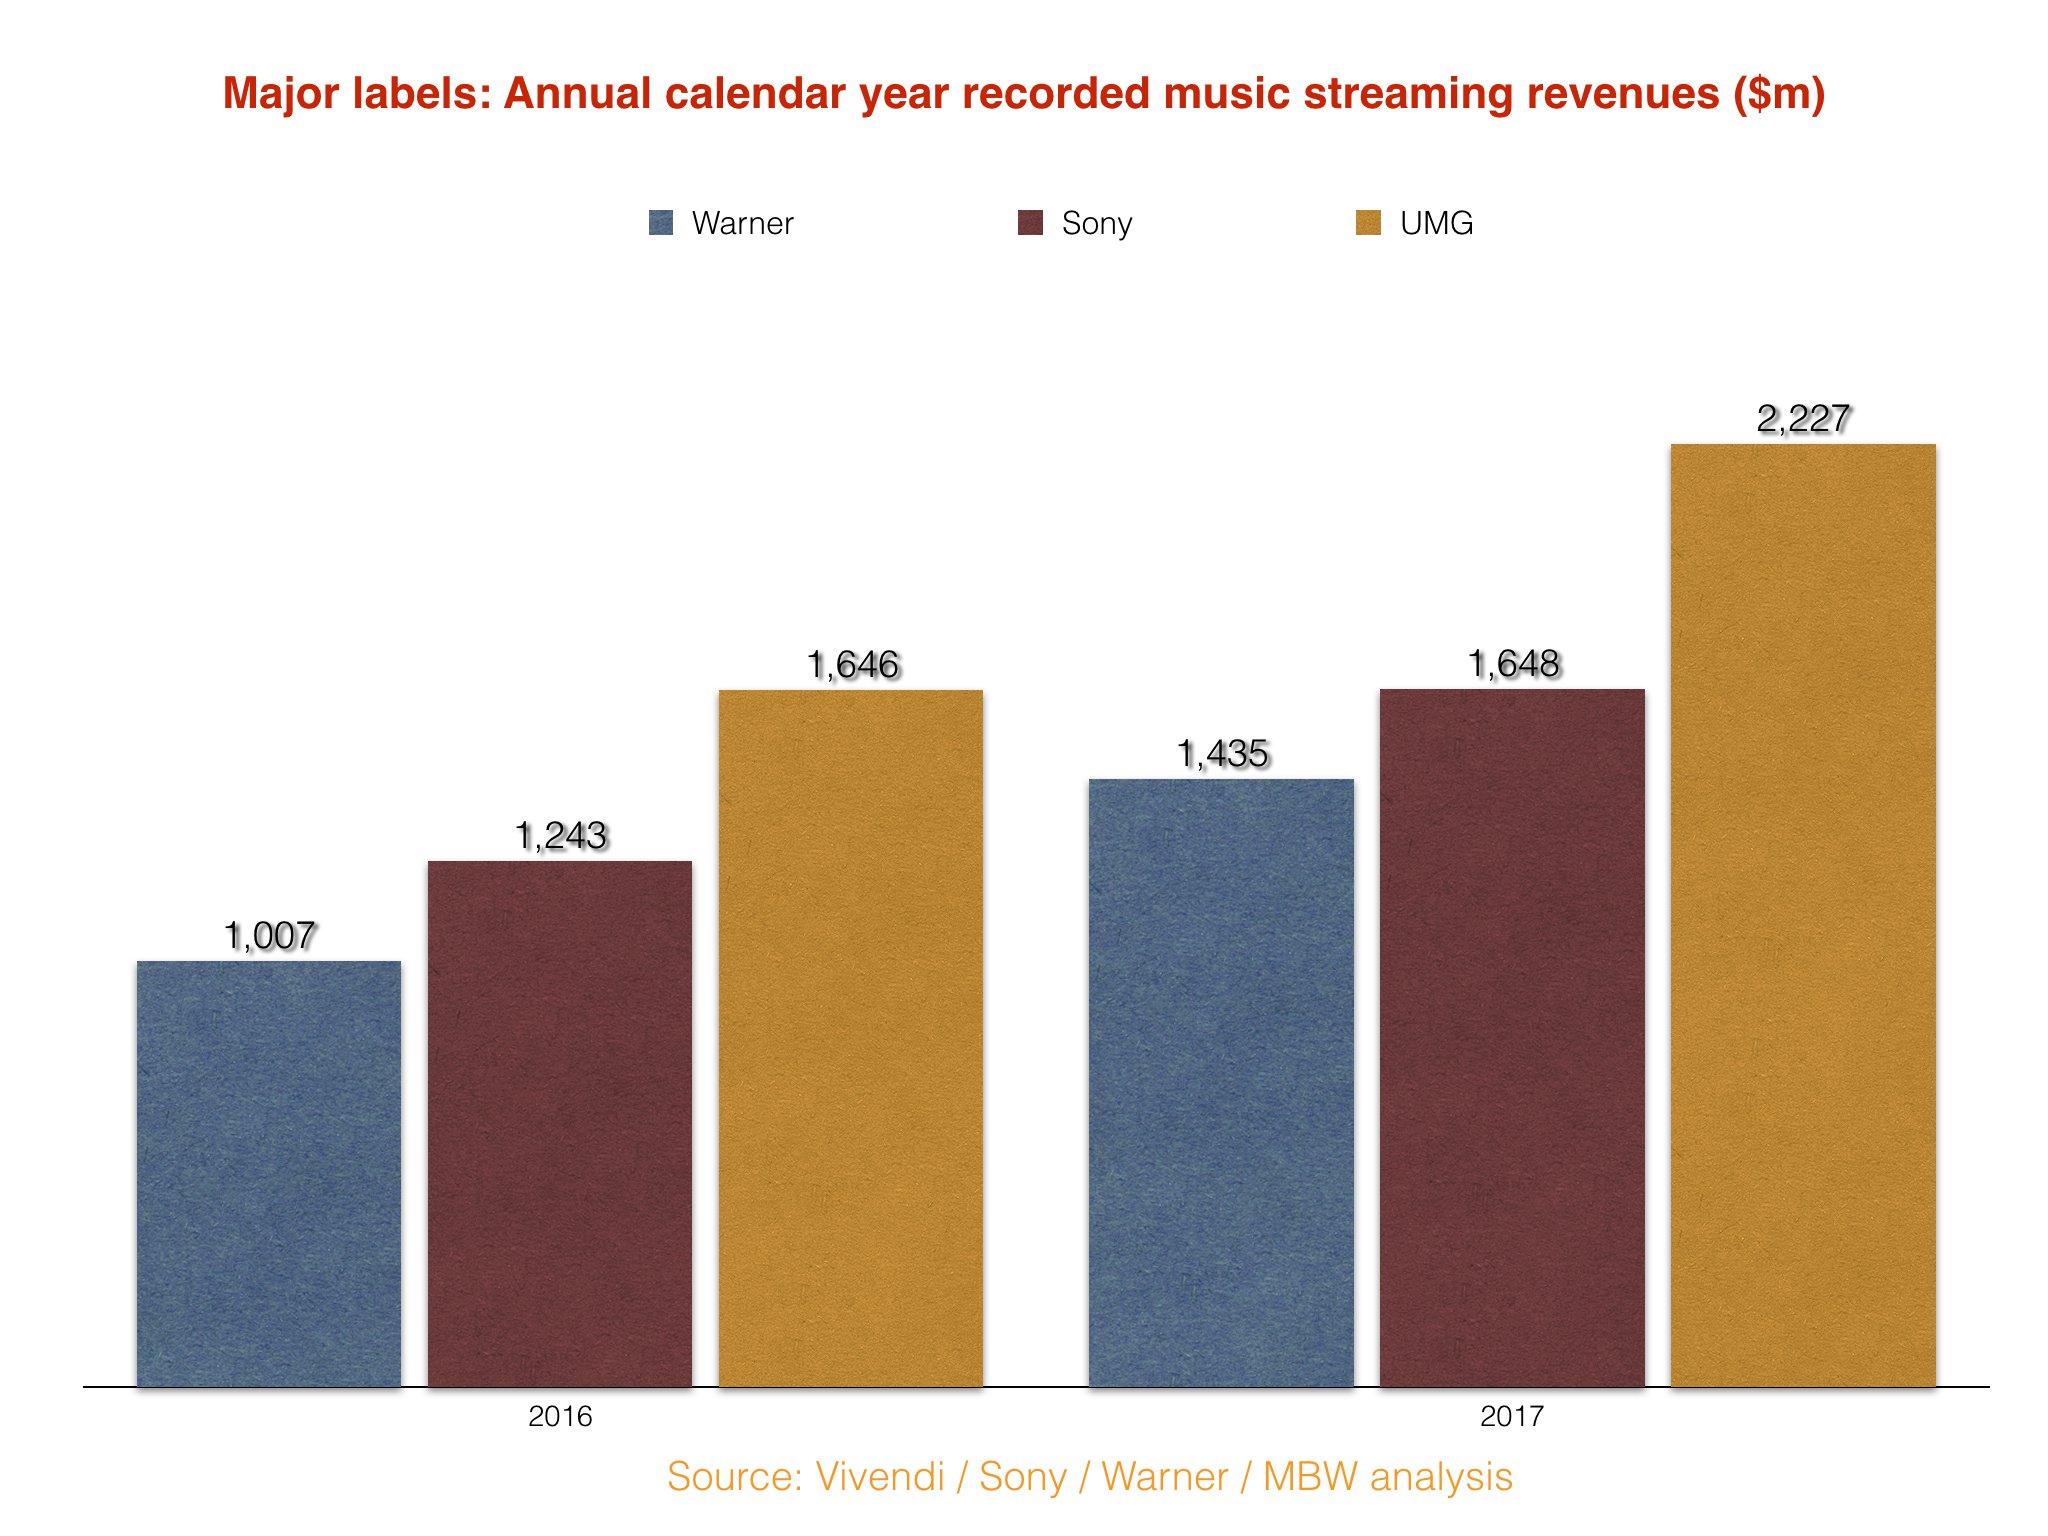
Once again, based on cumulative quarterly reports in the 2017 calendar year from Vivendi, Sony and Warner, we know what the major labels say they generated from streaming services in the 12-month period.
UMG was $2.23bn, Sony was $1.65bn and Warner was $1.44bn. (Again, see graph, inset.)
Working out the independent market share is, again, a straightforward process; remove the cumulative revenues of the major labels from the total 2017 streaming pie, as reported by the IFPI.
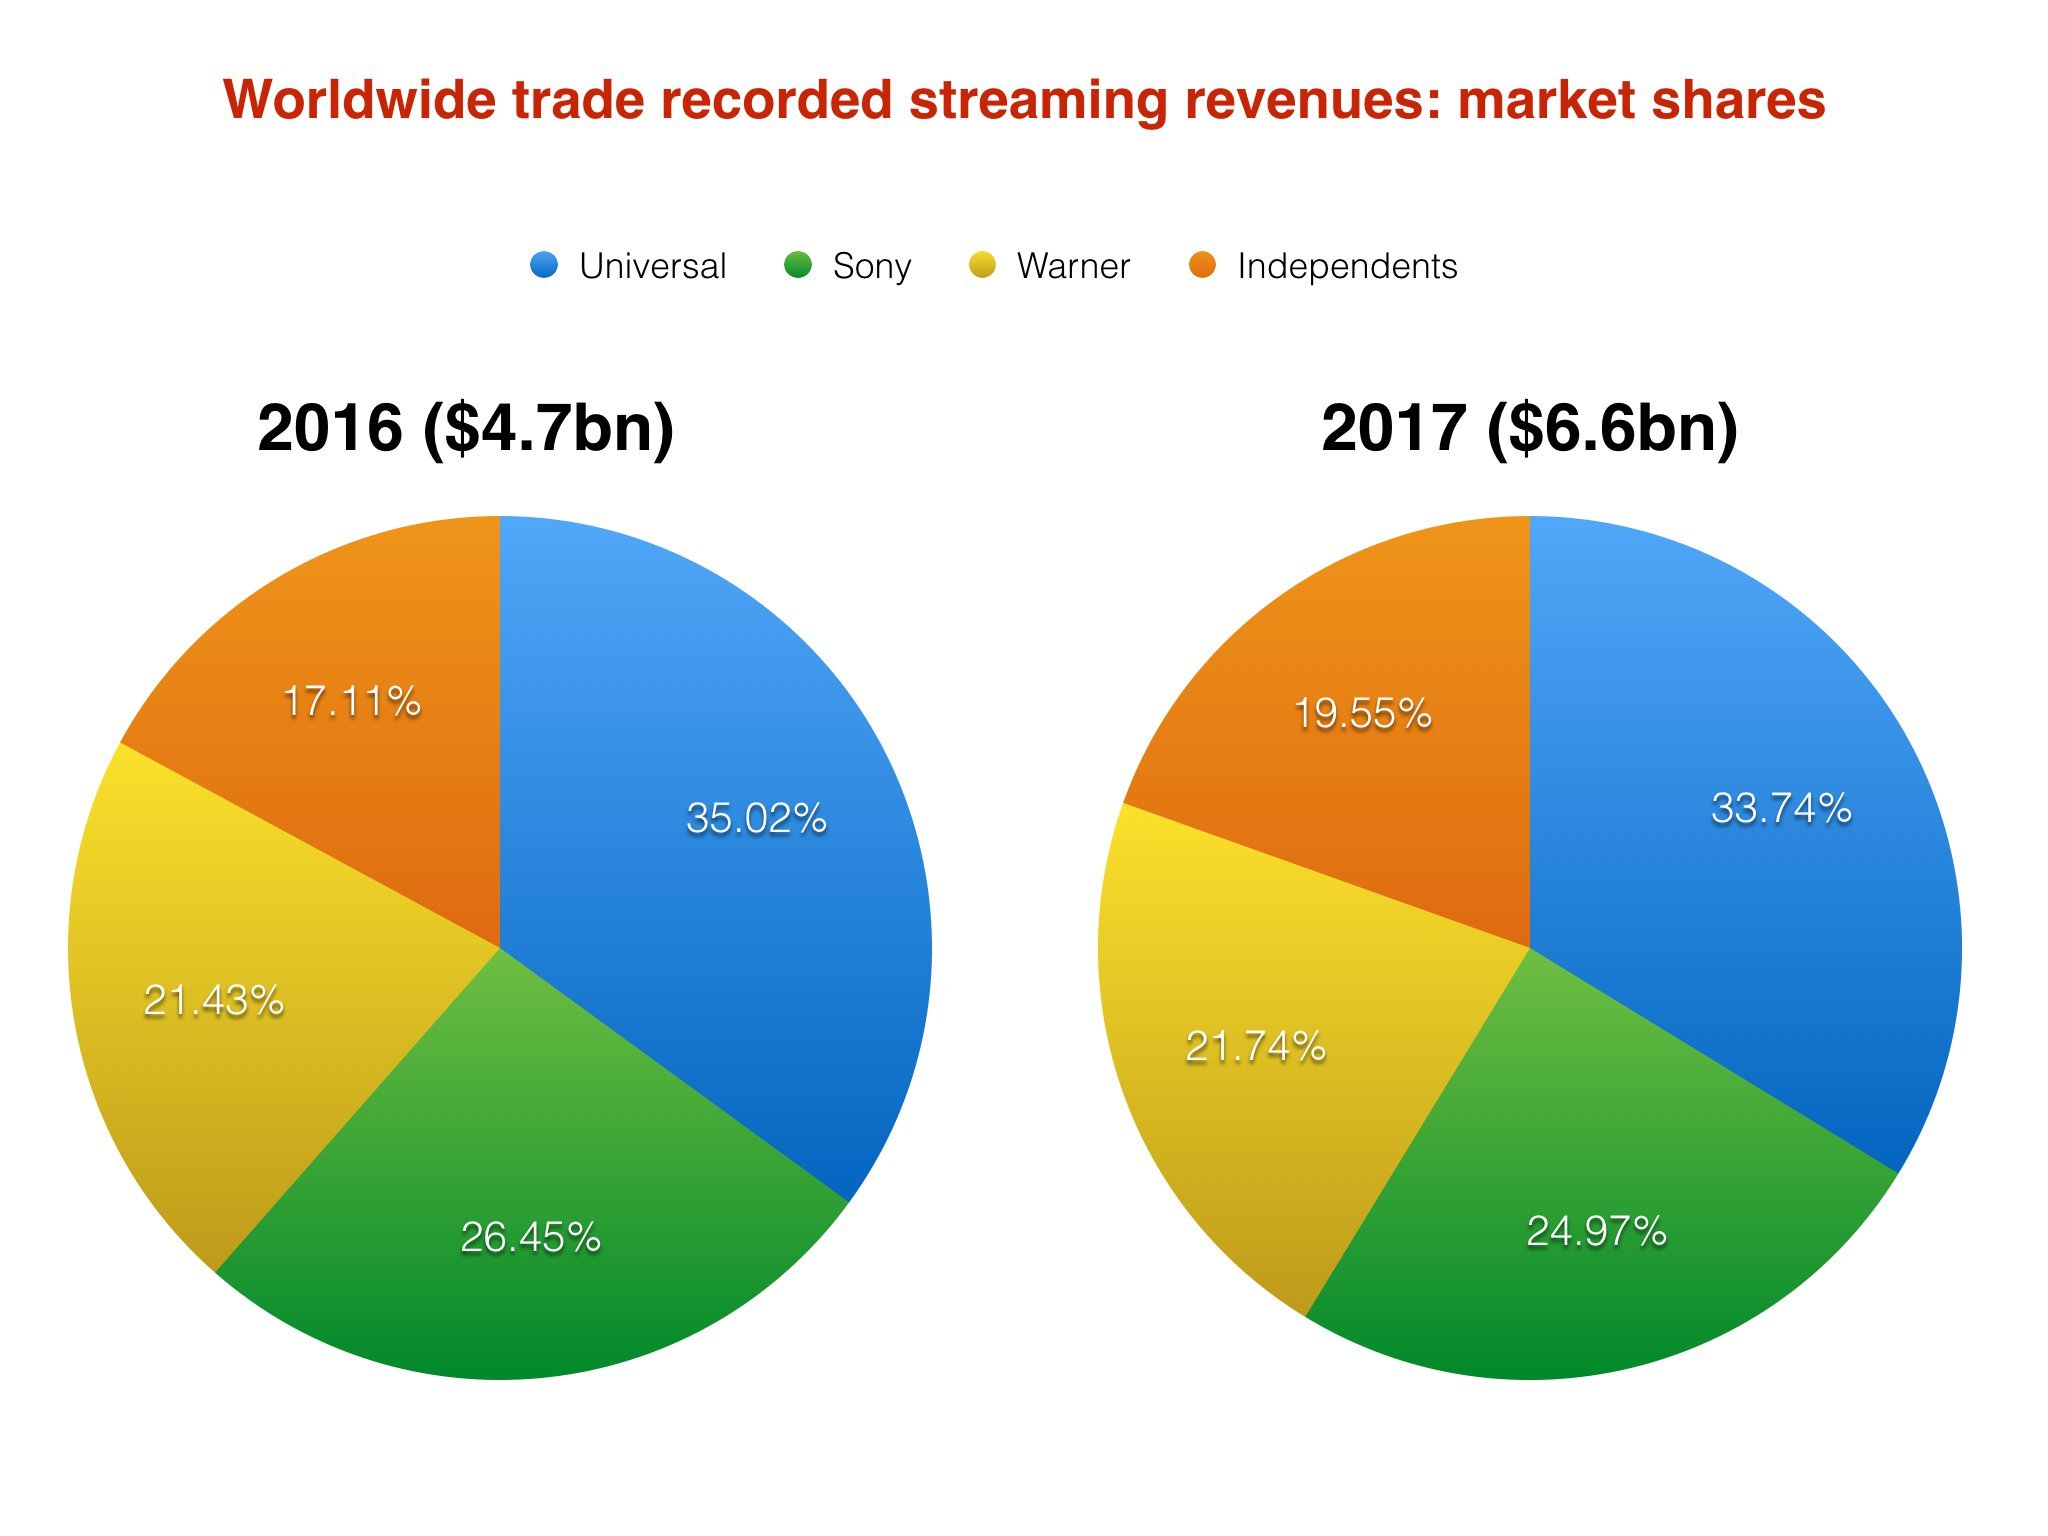
In 2017, this total IFPI streaming figure – across video, audio, subscription and ad-funded – was $6.6bn.
Subtracting the major’s reported streaming revenues leaves the indies with… $1.29bn.
That represented 19.55% of the 2017 global streaming market.
This is up over 2% on 2016 – but still surprisingly low when you consider that all of these market shares are based on distribution, rather than copyright ownership, and independents are theoretically less reliant on major labels to distribute their music online than they are in stores.
However, could this also be reflective of the dominance of pop and urban music on streaming services – powered by leading playlists?
And does that in turn mean, to use common parlance, the indies are getting a bit of a raw deal vs. the majors in terms of what’s promoted on streaming services? That the less-than-1% is dominated by UMG, Sony and Warner acts?
That’s obviously a debate which could rage all year… and probably will.
In 2016, the independent sector’s streaming revenue figure – again, judging on the IFPI total ($4.7bn) minus the combined reported major label streaming revenues – was $804m, resulting in a 17.11% market share.
Physical recorded music
In the world of physical recorded music, it’s a different story entirely.
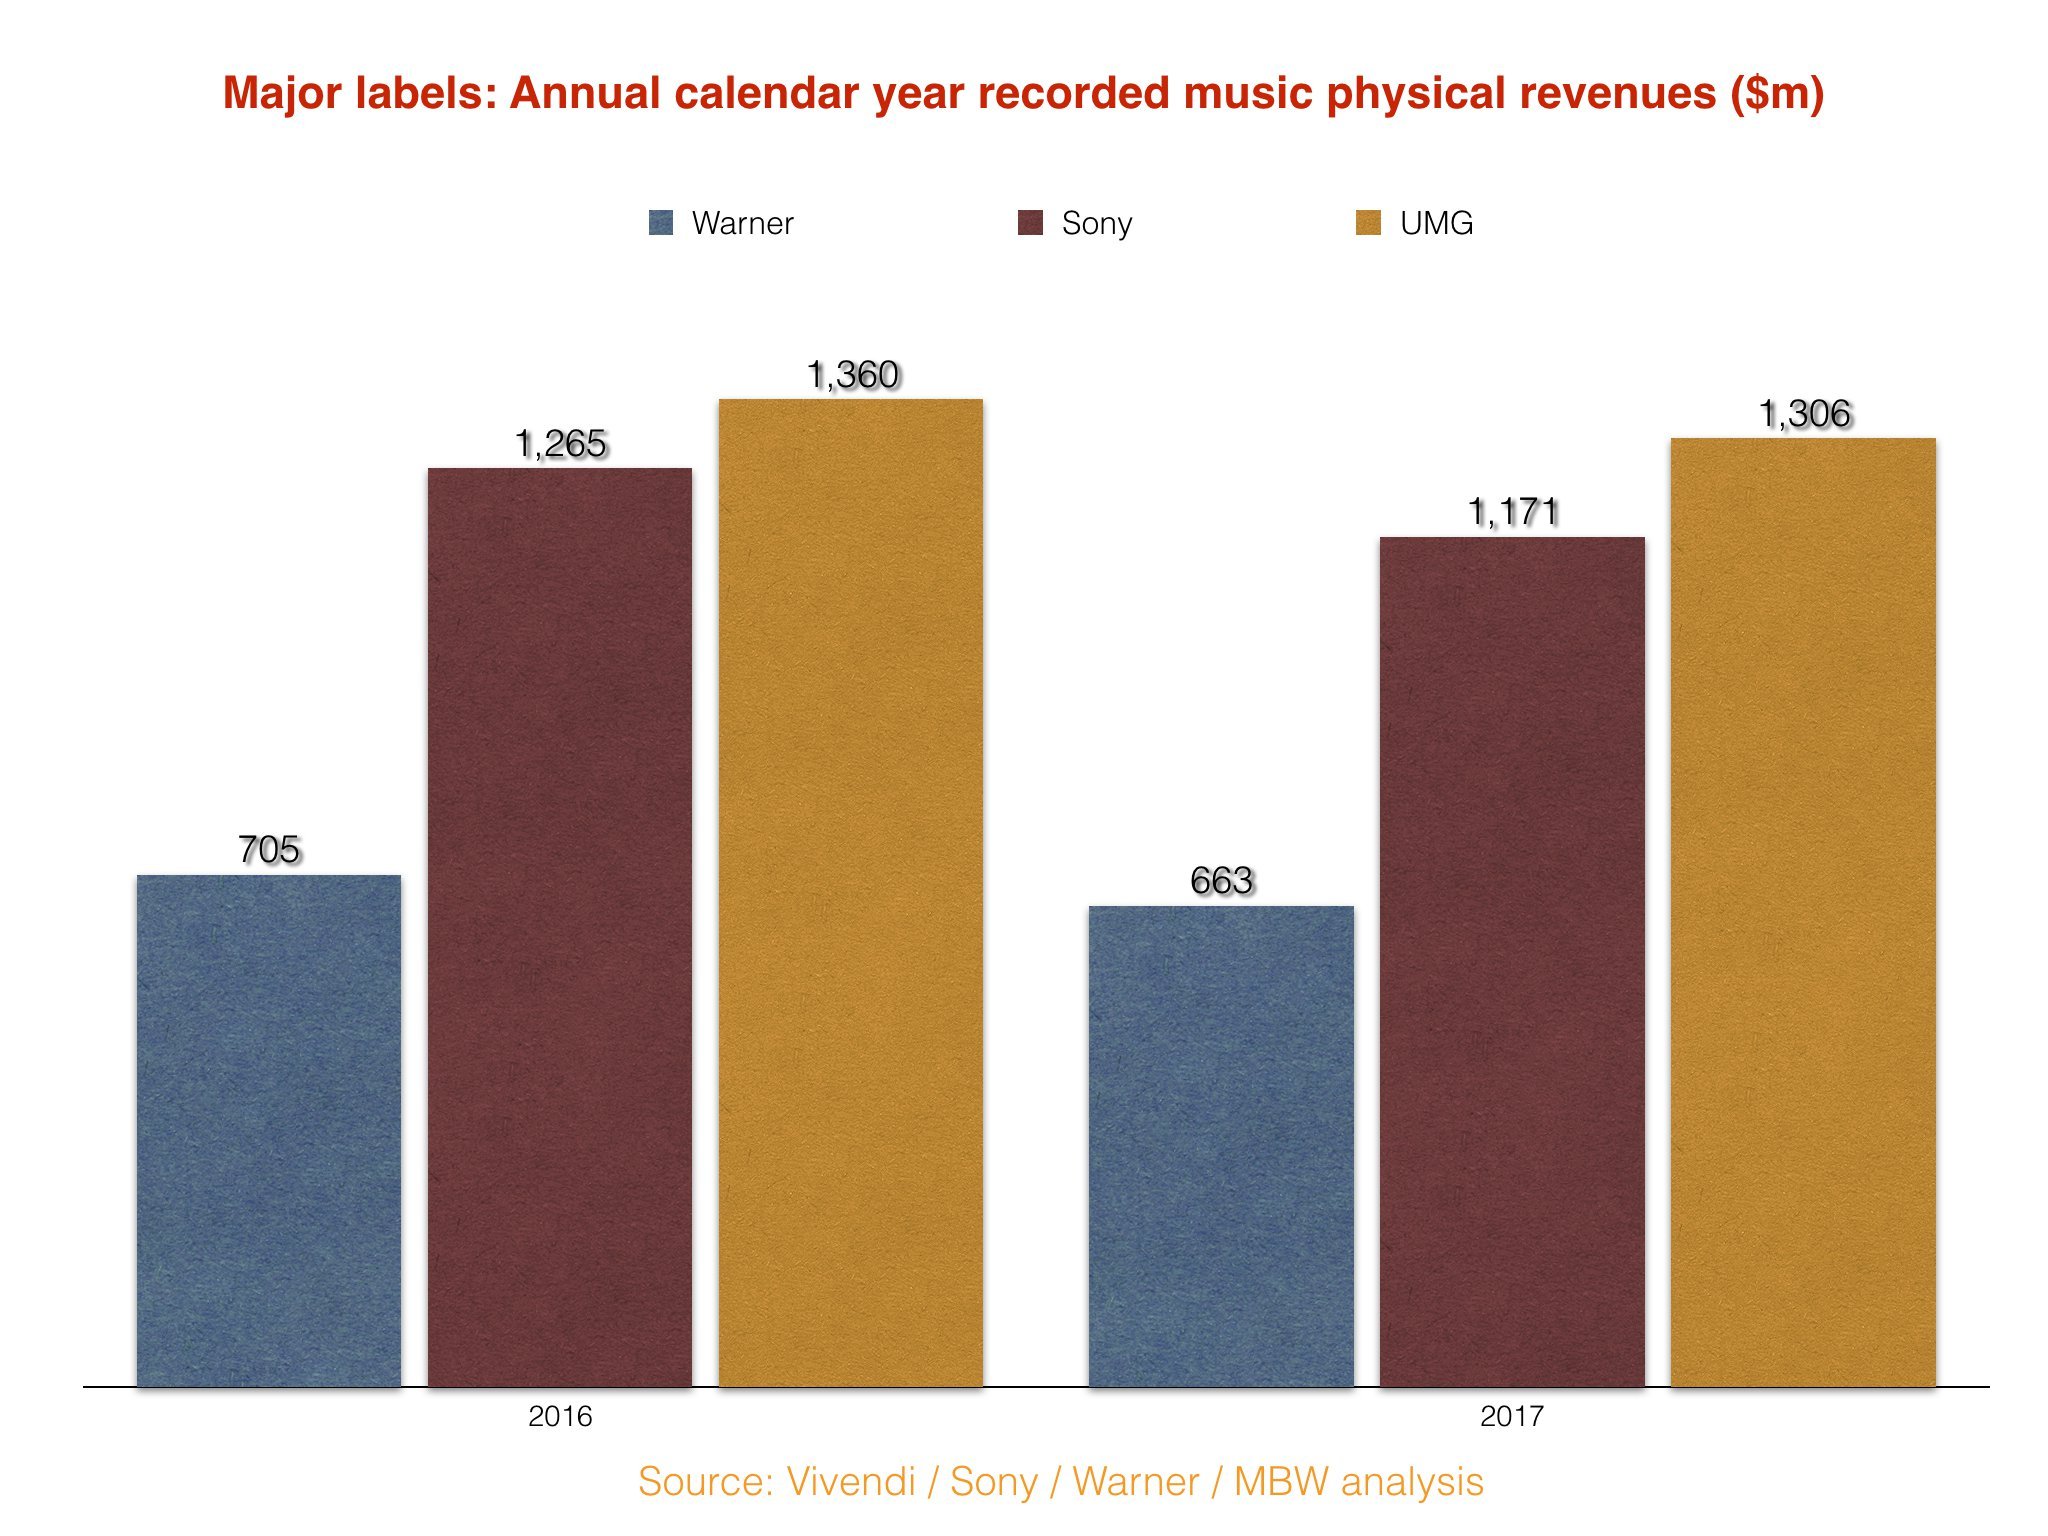
Again, the below chart is based on revenue figures reported across calendar 2017 by Vivendi, Sony and Warner for CD and vinyl sales.
UMG was $1.31bn, Sony was $1.17bn and Warner was $663m. (See graph, inset.)
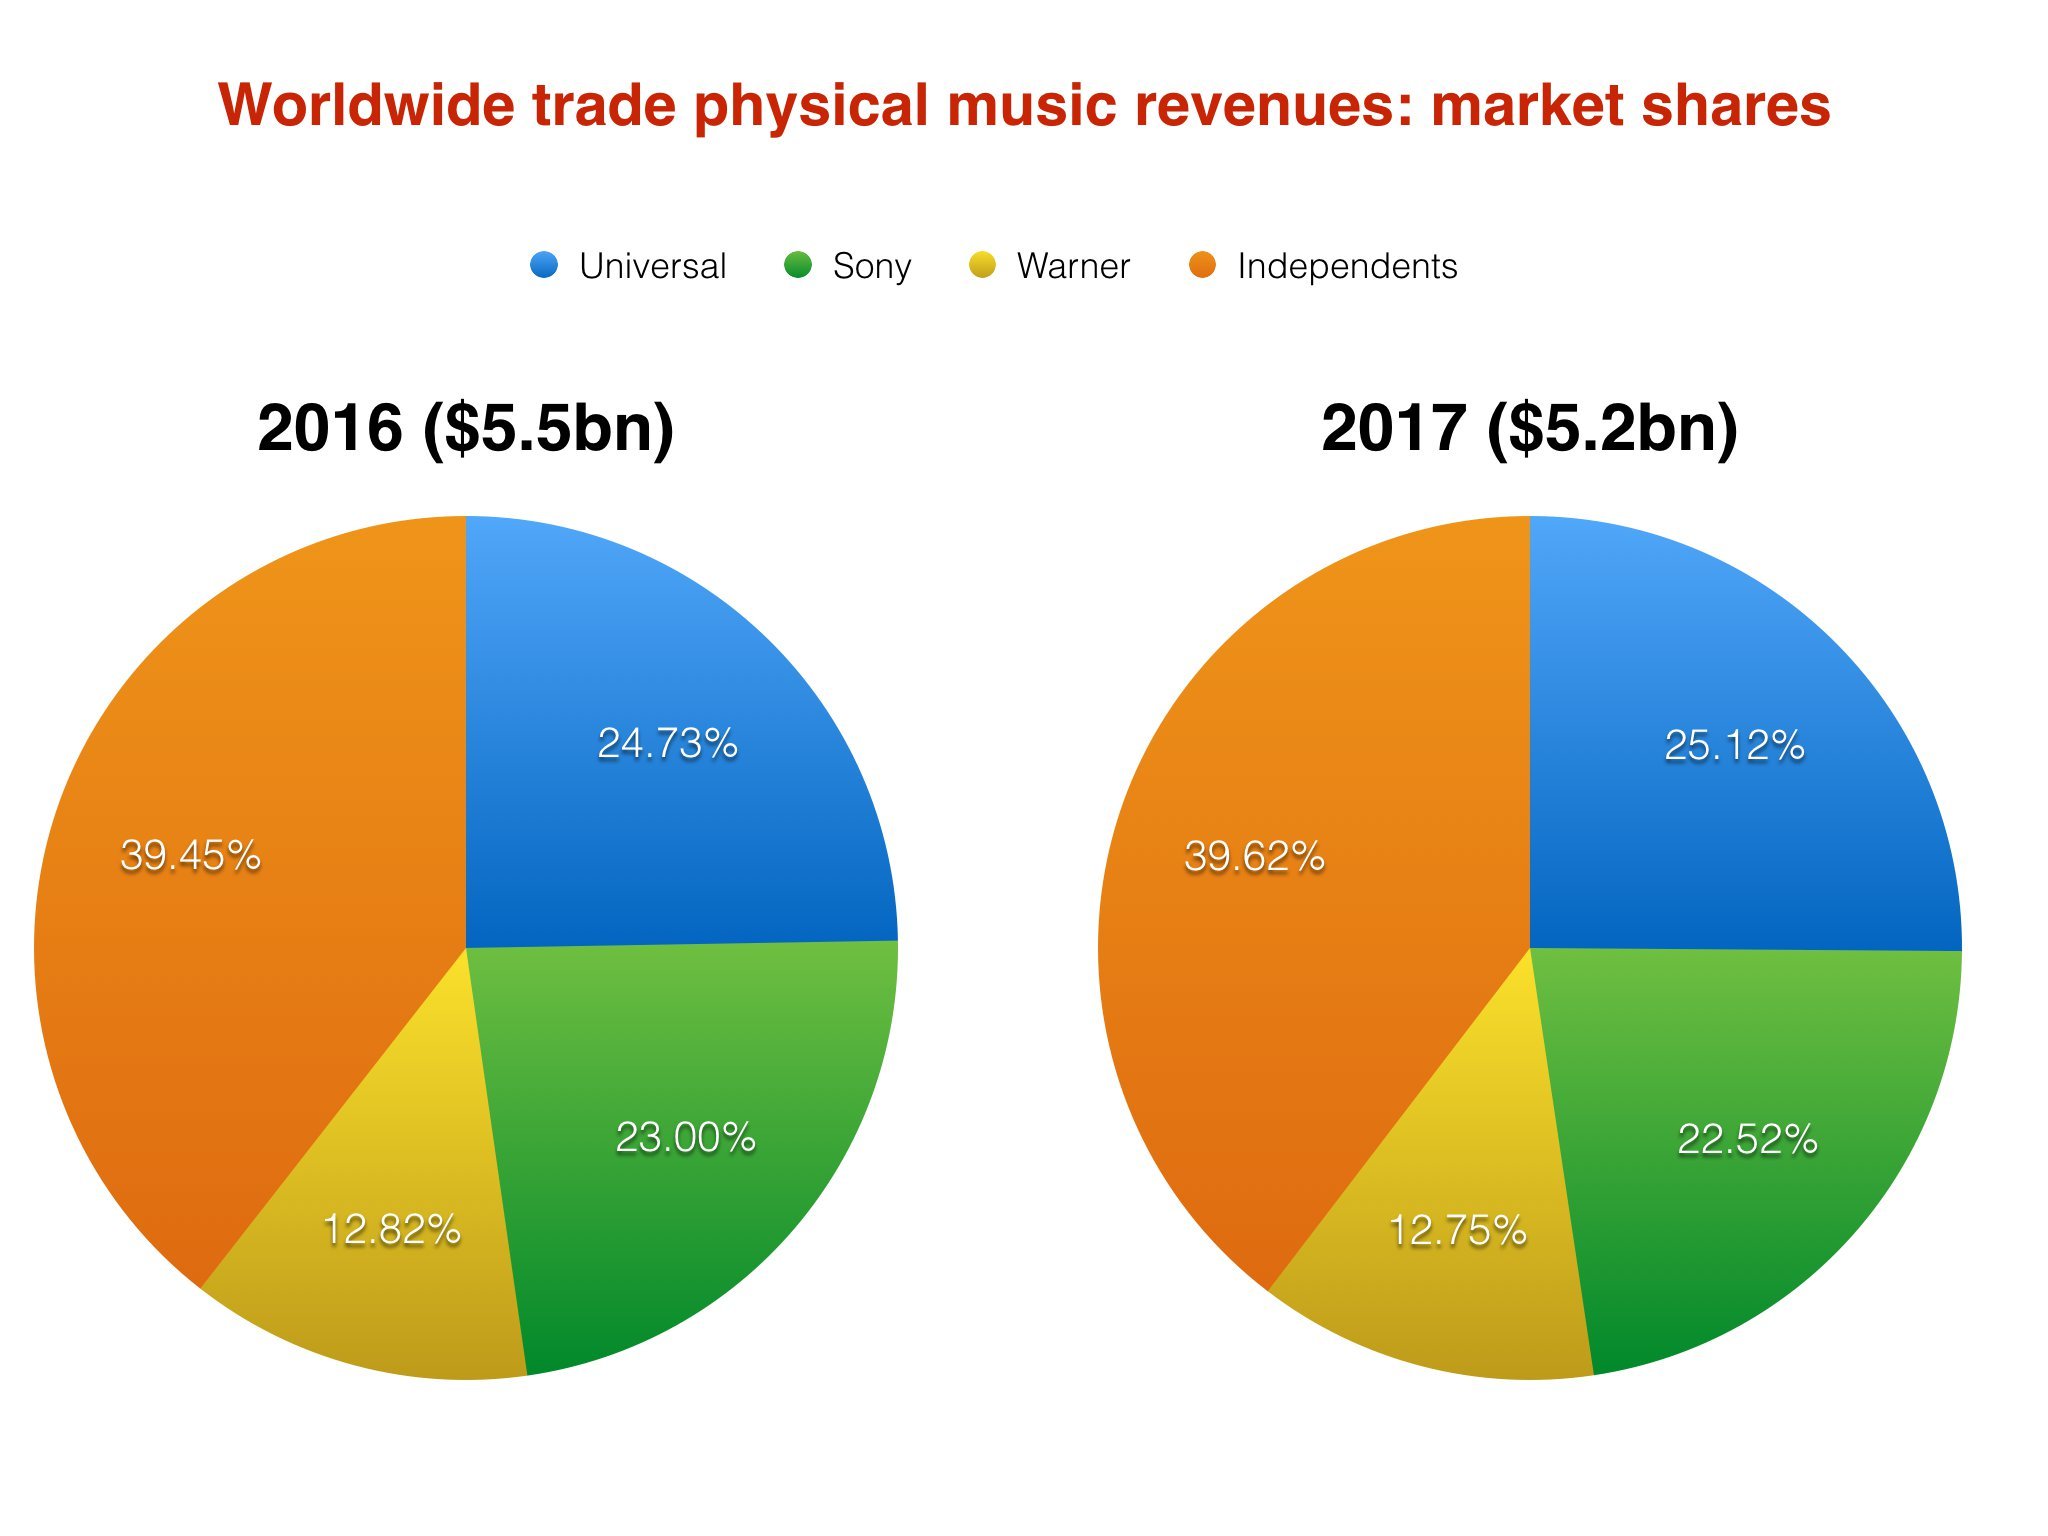
When these numbers are combined, and then subtracted from the IFPI total in 2016 and 2017, something interesting happens: independent market share of physical revenues is shown to be booming.
In 2017, according to these calculations, the independents turned over $2.06bn from physical sales, resulting in a 39.62% global market share.
And in 2016, the indies generated $2.17bn, claiming a 39.45% market share.
Important to remind you that these are wholesale revenues – ie. the money coming back to labels and artists after retailers have taken their cut.
According to the IFPI, global physical revenues only declined 5.4% in 2017, down to $5.2bn from $5.5bn in 2017.
Finally, it’s worth pointing out that we’ve only crunched detailed numbers for physical and streaming figures above; combined, these formats made up 68.2% of all revenues in the IFPI’s $17.3bn total in 2017.
Download and other digital ($2.8bn), plus performance rights ($2.4bn) and sync ($300m) made up the other 31.8% – or $5.5bn combined.
According to the numbers above, the independent sector claimed a 36.7% market share ($2.02bn) of this non-streaming/physical income.
Plus, once again, these numbers represent distribution market share. That means the money indie labels make as distribution partners of major labels will be accounted for… under those major labels.
* A NOTE ON CURRENCY CONVERSION.
MBW has used a currency conversion for both Sony Music Entertainment and Universal Music Group which sees both company’s global revenues – reported by Sony in Japanese Yen and Universal/Vivendi in Euros – reversed into US Dollars.
In order to do this for 2017’s figures, we used an average currency exchange rate taken across the 12 months of the calendar year, calculated via Oanda. For Universal, this meant a rate of €1 = $1.13. For Sony, it meant a rate of 1 Yen = $0.0089.
For 2016’s figures, we repeated this currency conversion style, but with the prevailing rate for that year in both cases, in order to create a constant currency picture in USD to aid the accuracy of market share movement. For Universal, this meant a 2016 rate of €1 = $1.11. For Sony, it meant a rate of 1 Yen = $0.0092.
Warner Music Group reports its results in the ‘root currency’ of USD, which we left unchanged for both 2016 and 2017.Music Business Worldwide